Stagnant Construction Productivity Is a Worldwide Problem
Deep Dives
Explore related topics with these Wikipedia articles, rewritten for enjoyable reading:
-
Baumol effect
15 min read
This economic theory directly explains why labor-intensive industries like construction struggle to improve productivity compared to manufacturing - wages rise across sectors but productivity gains are uneven, making construction relatively more expensive over time
-
Total factor productivity
9 min read
The article discusses labor productivity measurement using KLEMS databases but doesn't explain the broader concept of how economists measure productivity - understanding TFP provides crucial context for why construction productivity is so hard to measure and improve
-
Japanese asset price bubble
11 min read
The article notes Japan's flat construction productivity since the 1970s without explaining why - the 1980s bubble and subsequent 'Lost Decades' fundamentally reshaped Japanese construction practices and investment patterns
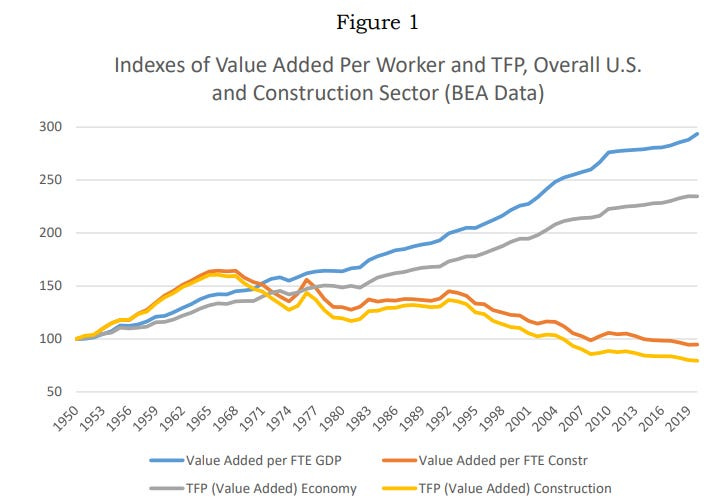
We’ve spent a lot of time examining the problem of construction productivity in the US — the fact that, across a variety of different metrics, construction never seems to get any more efficient (in terms of how much output you get for a given amount of input), or any cheaper. A paper I wrote about by Goolsbee and Syverson, for instance, titled “The Strange and Awful Path of Productivity in the US Construction Sector,” looked at a variety of different productivity metrics and found that they all show either flat or declining productivity. By contrast, other sectors (such as manufacturing), as well as the economy overall, tend to show increasing productivity.
Much of our investigations have been focused specifically on the issues of construction productivity in the US. But it’s also worth looking at construction productivity trends in other countries — if other countries are showing steadily improving construction productivity, that may give us ideas for ways to improve US construction productivity. If they’re not improving, by contrast, that suggests that US-specific things (such as various regulations) aren’t what’s holding American construction productivity back.
International construction productivity
To look at international construction productivity, we can use KLEMS databases, which aggregate productivity statistics for different industries in countries around the world. (KLEMS stands for capital (K), labor (L), energy (E), materials (M), and services (S).) These KLEMS datasets are a bit scattered and not amazingly well-maintained (I had to retrieve a lot of the data from archive.org), but by pulling them together we can assemble construction productivity datasets for dozens of different countries going back quite far:
The EU KLEMS dataset has productivity data for European nations, as well as a smattering of other countries. The current EU KLEMS release goes from 1995 to 2021, and in addition to European countries also includes the US, the UK, and Japan. Older EU KLEMS releases (I used the 2008 release) go all the way back to 1970, and in addition to the US, UK, and Japan, also include Korea, Canada, and Australia.
Asia KLEMS has productivity data for Korea, Japan, Taiwan, and India, going from 1980 to 2012.
LA KLEMS has productivity data for several latin american countries, going from 1990 to around 2019.
World KLEMS, in addition to links to the above datasets, also has links to Canada, Russia, and China KLEMS data.
To calculate
...This excerpt is provided for preview purposes. Full article content is available on the original publication.