Monday Musings (5/13/19)

Maps don’t have to be accurate. In fact, many of the best maps are inaccurate. On purpose.
Every map serves a goal. Sailors use maps to navigate the distant seas, pilots use maps to navigate the expansive skies, and drivers use maps to navigate the winding pavement. Often, they shine because they’re not accurate.
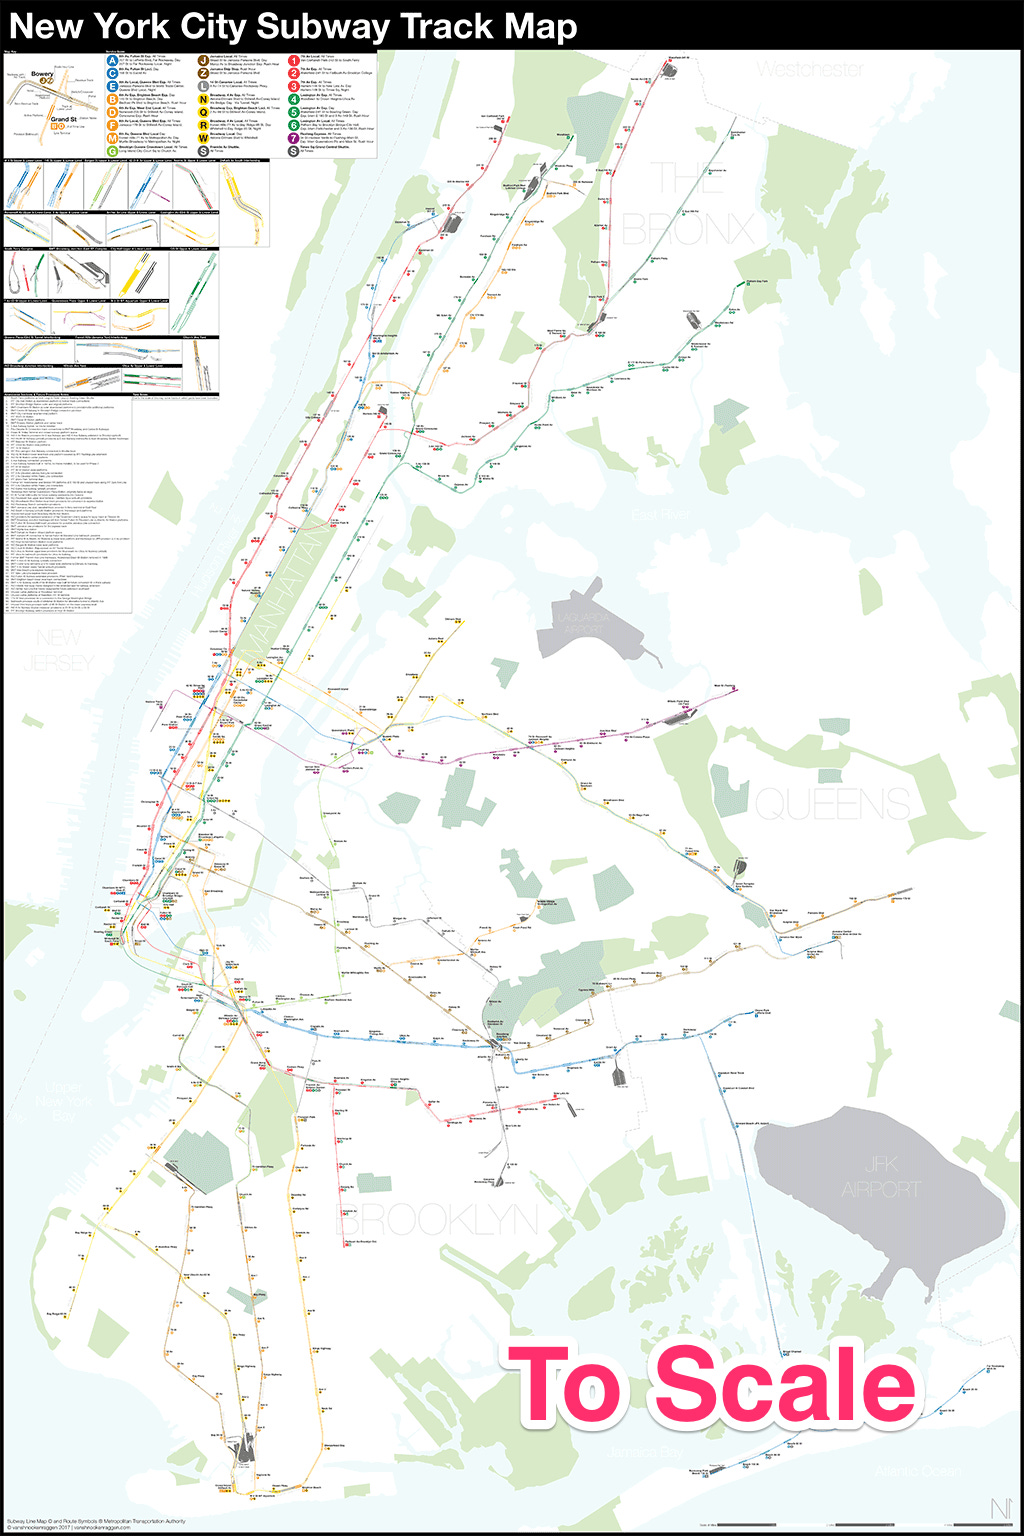
For example, the map of New York’s subway shrinks the massive borough of Staten Island and makes Manhattan look bigger than it really is. And yet, because the map is so inaccurate, it’s easy to read.
Believe it or not, maps weren’t always easy to read.
In 1933, Henry Beck saw that the London Underground was too hard to understand, so he simplified the subway map. He controversially abandoned geographic accuracy, which was the standard for maps until then. Instead, Beck focused on connections between trains and the network of stations.
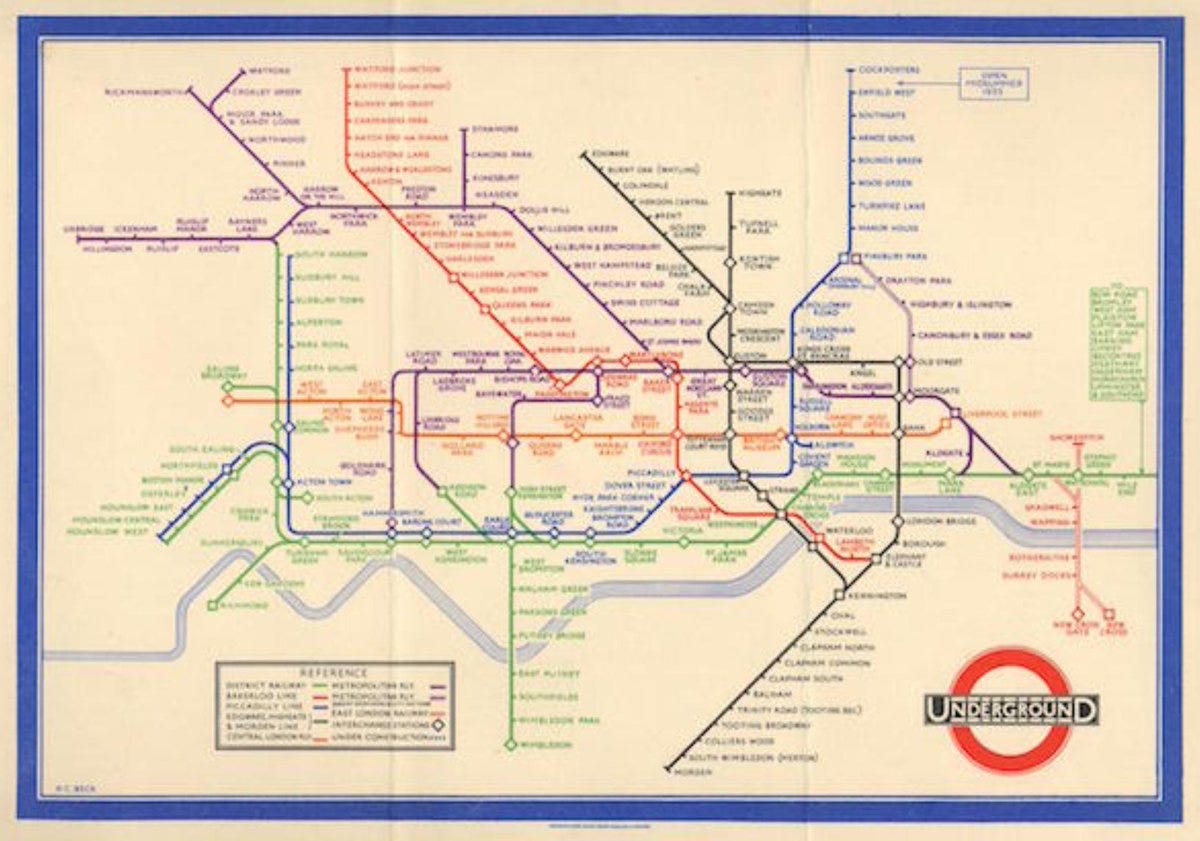
People who look at subway maps want to see the station names and the path of each subway line. If they need to transfer, it should be easy for them to find the connection point.
The faster, the better.
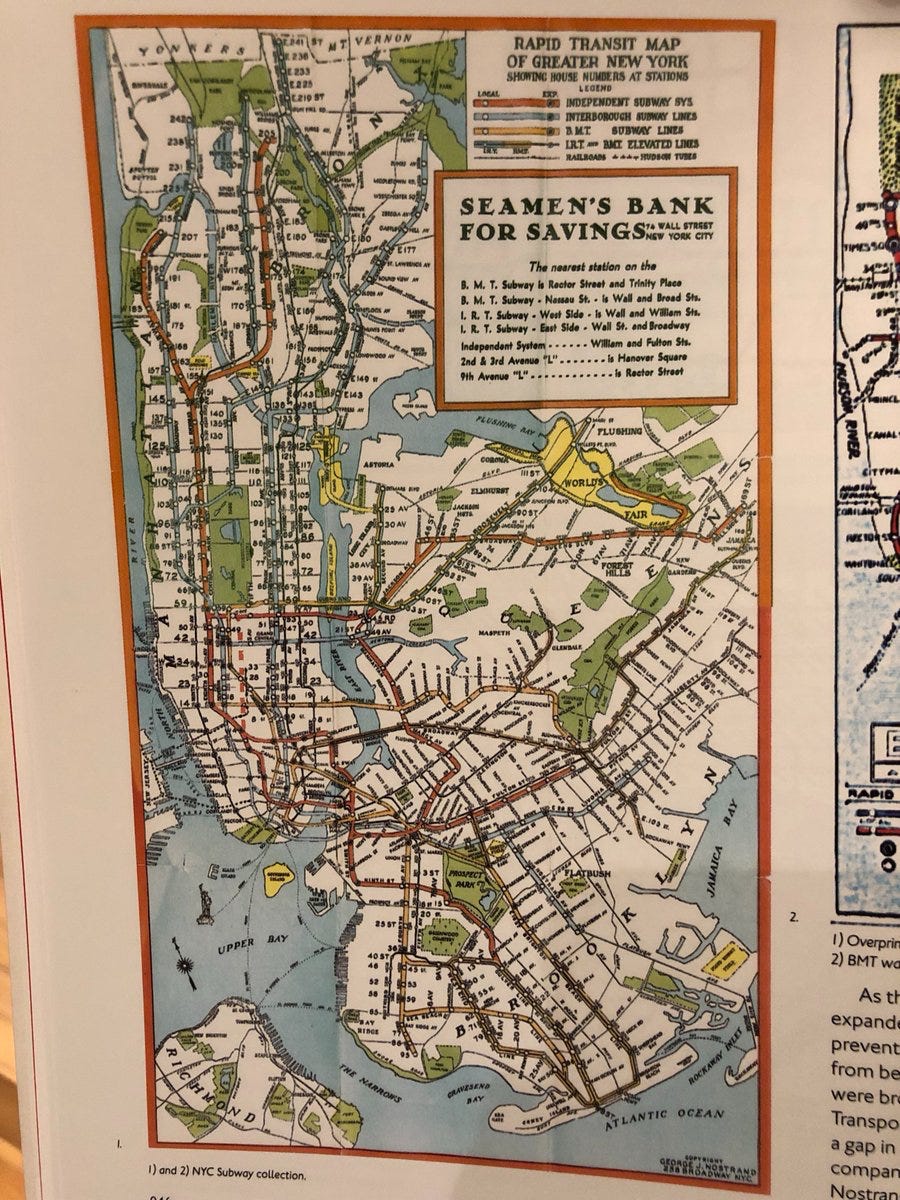
There are many ways to visualize a city. The old map of the New York subway system (shown below) is ugly and hard to read. The colors are dull, the trains are hard to follow, and the information hierarchy is poorly presented.
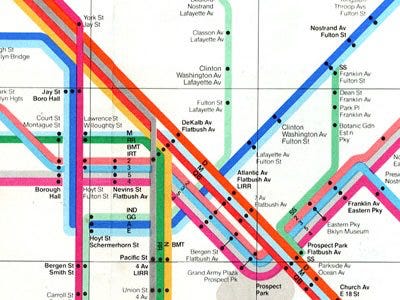
For years, the New York subway map was hard to read and even harder to use. Then, Massimo Vignelli arrived. By combining graceful sans-serif fonts with straight lines and bright colors, he transformed the New York subway map.
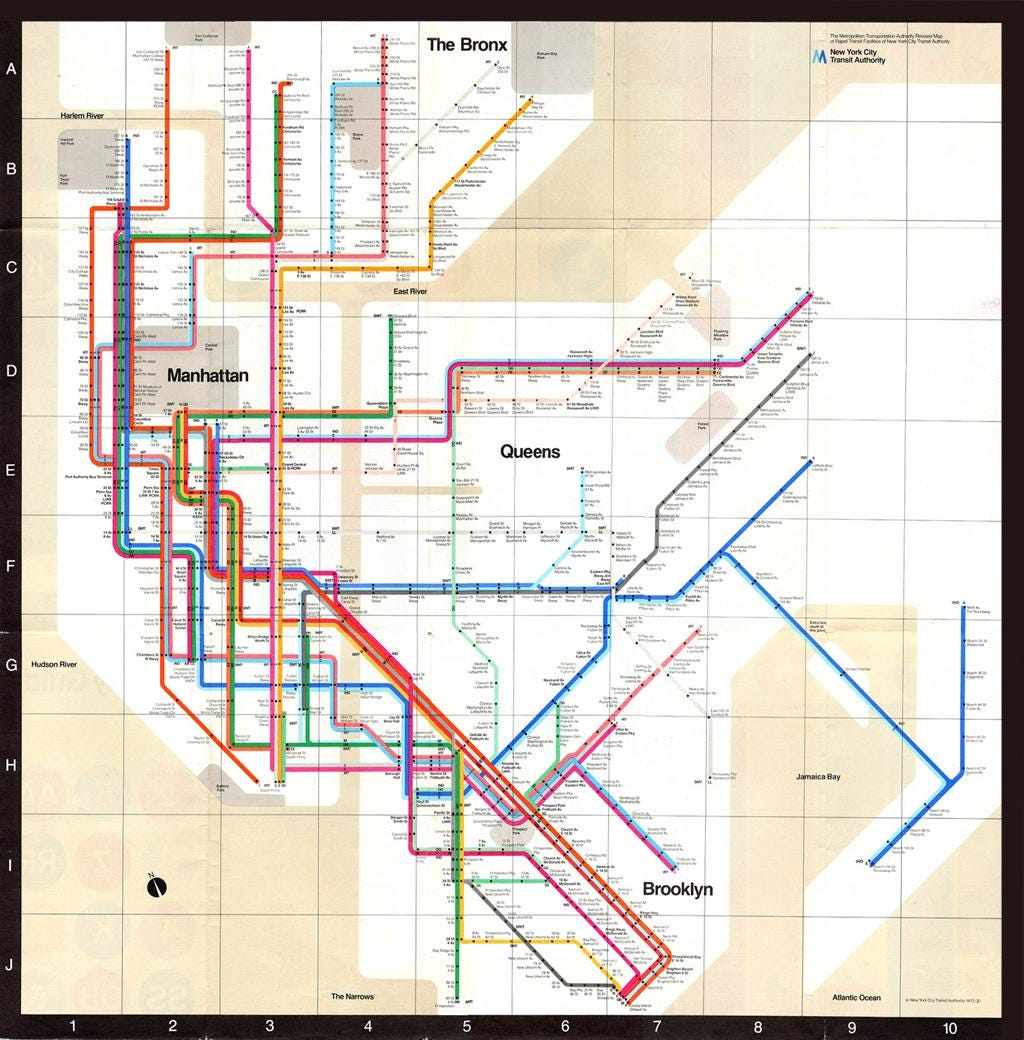
Since the Vignelli map serves the needs of the commuter, it’s geographically inaccurate. Rather than drawing the map to scale, the map expands the dense areas and contracts the sparse ones. Manhattan, where most of the action takes place in New York, is bigger.
The hierarchy of information is clear. Since the borough names are big, readers can orient themselves quickly. The dots make it easy to find your stop. Each subway line has its own bright color, which makes it easy to differentiate between subway lines. The bright colors make it easy to differentiate between subway lines. There are no messy angles. Rather, all the lines run only at 45 or 90-degree angles.
Plus, the Vignelli map is beautiful.
If you look closely, you’ll see Vignelli’s influence in the modern New
...This excerpt is provided for preview purposes. Full article content is available on the original publication.