5 (more) charts that explain crypto right now
Deep Dives
Explore related topics with these Wikipedia articles, rewritten for enjoyable reading:
-
Hawala
9 min read
The article discusses Western Union's stablecoin plans for cross-border transfers in emerging markets. Hawala is the centuries-old informal value transfer system that has long served similar populations - understanding this parallel helps readers appreciate both the historical precedent for decentralized money movement and the regulatory challenges stablecoins face in displacing entrenched systems.
-
Tornado Cash
1 min read
The article specifically mentions OFAC lifting sanctions on Tornado Cash as an indicator of growing privacy momentum. The full story of Tornado Cash - how it works technically, why it was sanctioned, the arrest of its developers, and the legal precedent set by the sanctions being lifted - is a pivotal case study in the tension between blockchain privacy and regulatory enforcement.
IN THIS EDITION:
The data behind the stablecoin surge and four more metrics that explain crypto right now
What’s different about measuring growth in crypto — which metrics no longer apply and which need to be adapted
The a16z crypto team talks State of Crypto 2025
Stablecoins meet IRL payment rails
As we start looking back on 2025, here are five of the metrics that defined the industry this year, from stablecoin transaction volume to developer activity and blockchain throughput.
And for more key indicators, check out our State of Crypto dashboard, which we released last week.
Stablecoins are doing trillions in transaction volume
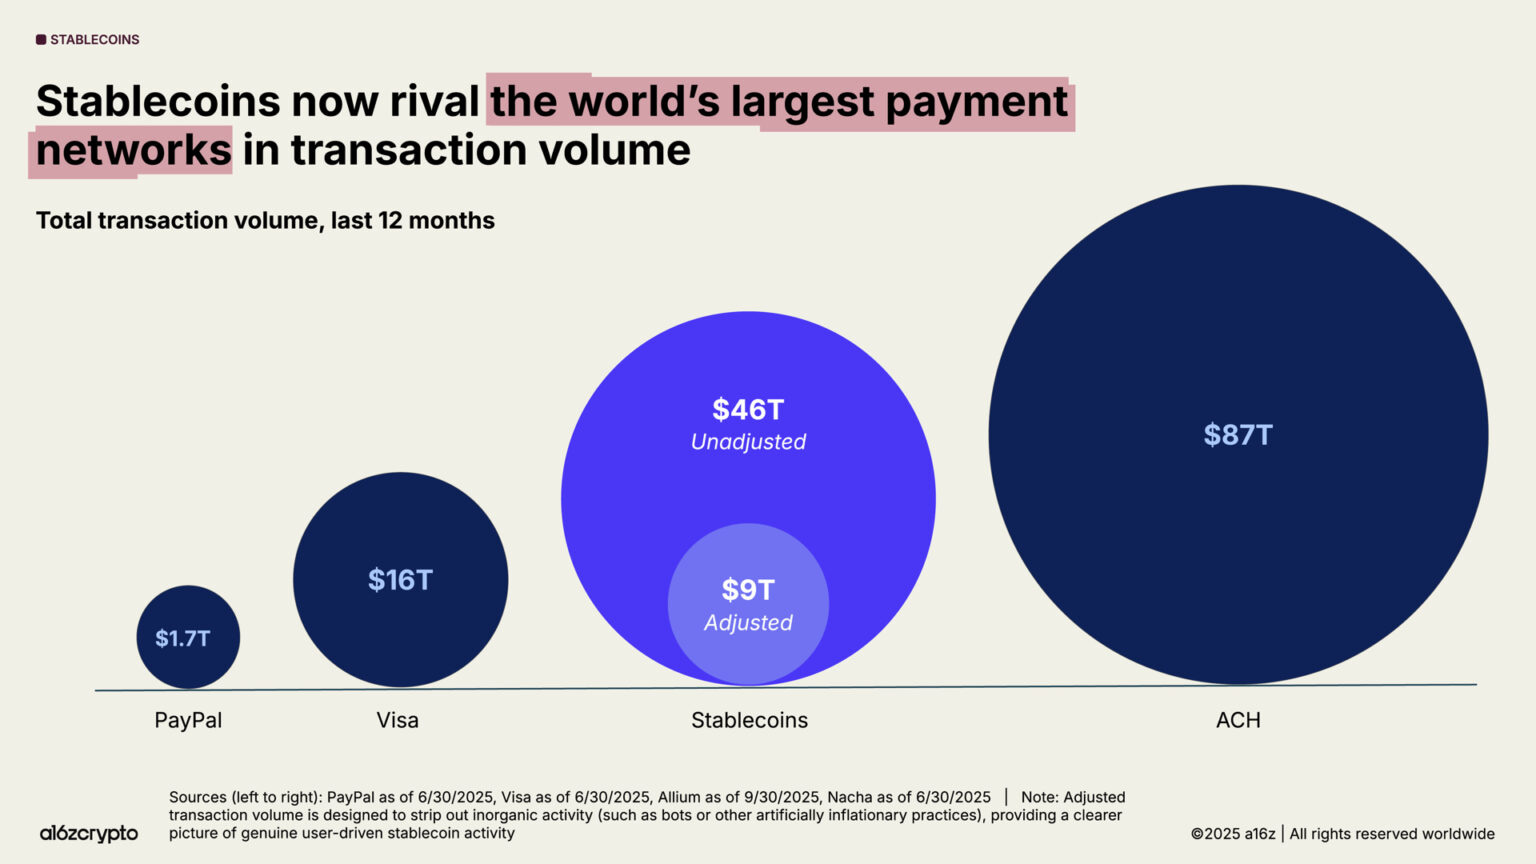
Stablecoins have become a global macroeconomic force.
They’ve done $46 trillion in total transaction volume in the last year, up 106% from the year before. That’s nearly 3x that of Visa’s transaction volume, and is approaching the volume of the ACH network that plumbs the entire U.S. banking system.
While these are not apples-to-apples comparisons, the sheer volume highlights just how large this trend has become. (The stablecoin figures mostly represent financial flows versus retail payments for card and other networks.)
A better measure of organic activity looks at adjusted stablecoin transaction volume, which filters out bots and other artificially inflationary activity. On this basis, stablecoins have done $9 trillion in volume in the last 12 months. This is more than 5x PayPal’s throughput.
It’s worth noting that stablecoin volume is now mostly uncorrelated with broader crypto trading volume, which suggests that stablecoins have found organic use cases and product-market fit beyond crypto market activity.
So why have stablecoins exploded so quickly in size and popularity? Head of Data and Fund Strategy Daren Matsuoka explains:
Blockchains can process more than 3,400 transactions per second
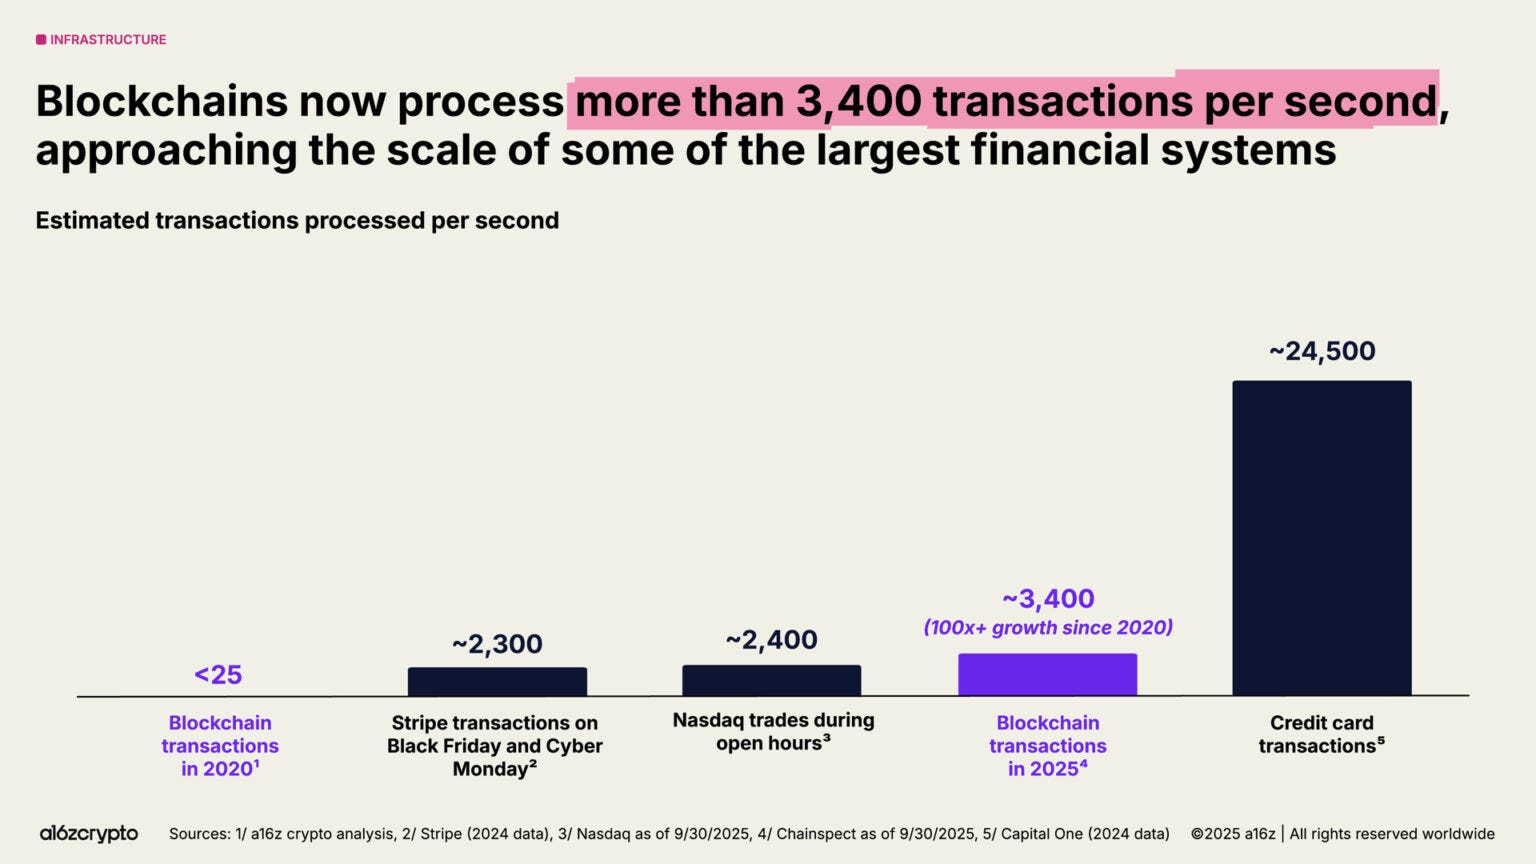
In just five years, aggregate transaction throughput across major blockchain networks has increased more than 100x.
Back then, blockchains processed fewer than 25 transactions per second. Now they process 3,400 transactions per second, which is on par with Stripe’s global throughput on Black Friday — at a fraction of the historical cost.
Solana’s high-performance, low-fee blockspace now underpins everything from DePIN projects to NFT marketplaces, with its native applications generating $3 billion in revenue in the past year.
As Ethereum continues to execute on its scaling roadmap, most of its economic activity is migrating to L2s. Average transaction costs on L2s have dropped from around $24 in 2021 to less
...This excerpt is provided for preview purposes. Full article content is available on the original publication.