Eight Slides on the Future of Electricity Prices
Deep Dives
Explore related topics with these Wikipedia articles, rewritten for enjoyable reading:
-
Capacity factor
10 min read
The article criticizes wind and solar as 'unreliable' generators that don't contribute to reliability despite adding capacity. Understanding capacity factor - the ratio of actual output to maximum possible output - is essential to grasping why nameplate capacity differs from reliable generation and why the author argues these investments are 'malinvestment'.
-
Duck curve
8 min read
The article discusses California's PG&E adding 8,000 MW of battery storage to 'manage wind and solar generation.' The duck curve phenomenon explains why this storage is needed - the dramatic ramp-up in net demand when solar generation drops at sunset - and provides crucial context for understanding grid management challenges with renewable integration.
-
Rate-of-return regulation
11 min read
The article's central argument about 'greenplating' hinges on how utilities profit from capital expenditures through regulated rates of return. Understanding this regulatory model - where utilities earn guaranteed returns on approved capital investments - explains why the author argues utilities have incentives to maximize capital spending regardless of efficiency.
“We are living in the future, I’ll tell you how I know, I read it in a rate case, 15 months ago.” John Prine, if he were an electricity analyst

If you want to understand where electricity prices are going in the future, you need to pay attention to Integrated Resource Plans and rate cases filed at utility commissions today. This is a key reason why we purchased a subscription to the S&P Global Capital IQ database, which has extensive data on these proceedings.
All of the slides you are about to see are from S&P’s North American Electric Utilities Review, which is a quarterly update on key trends and themes in the performance of 39 investor-owned utilities in the U.S. and five in Canada.
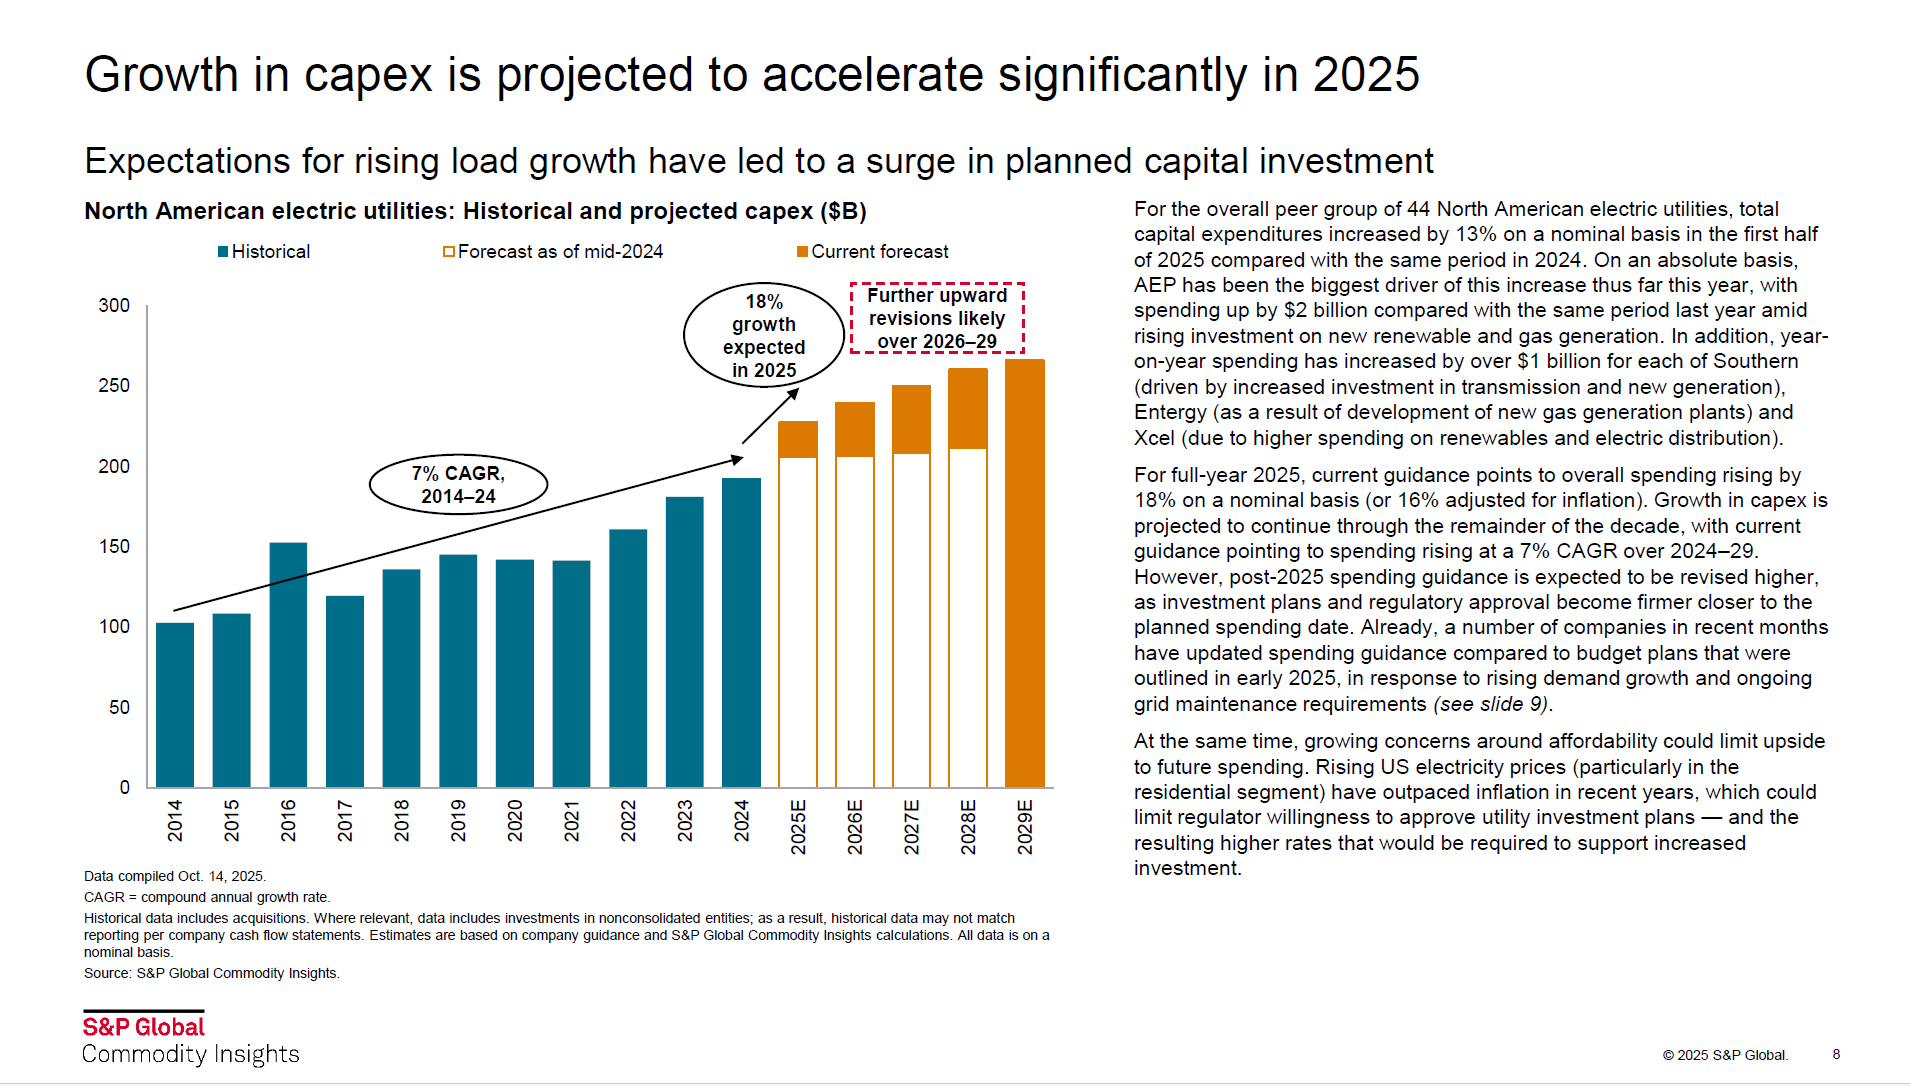
Capital Spending is Set to Explode
As we detailed in Greenplating the Grid, utilities make their money by spending money on capital assets. As long as utility regulators approve these capital expenditures, utilities can earn a full rate of return on the assets, which is why so many of them adopted voluntary carbon-free goals—the “green” movement was essentially a blank check for utilities to rate base as much as they wanted.
From 2014 through 2024, utilities had a 7 percent compound annual growth rate (CAGR) for capital expenditures. S&P expects this to jump to 18 percent from 2024 through the end of 2025, and future forecasts will almost certainly revise these spending estimates upward to meet the growing load from data centers.
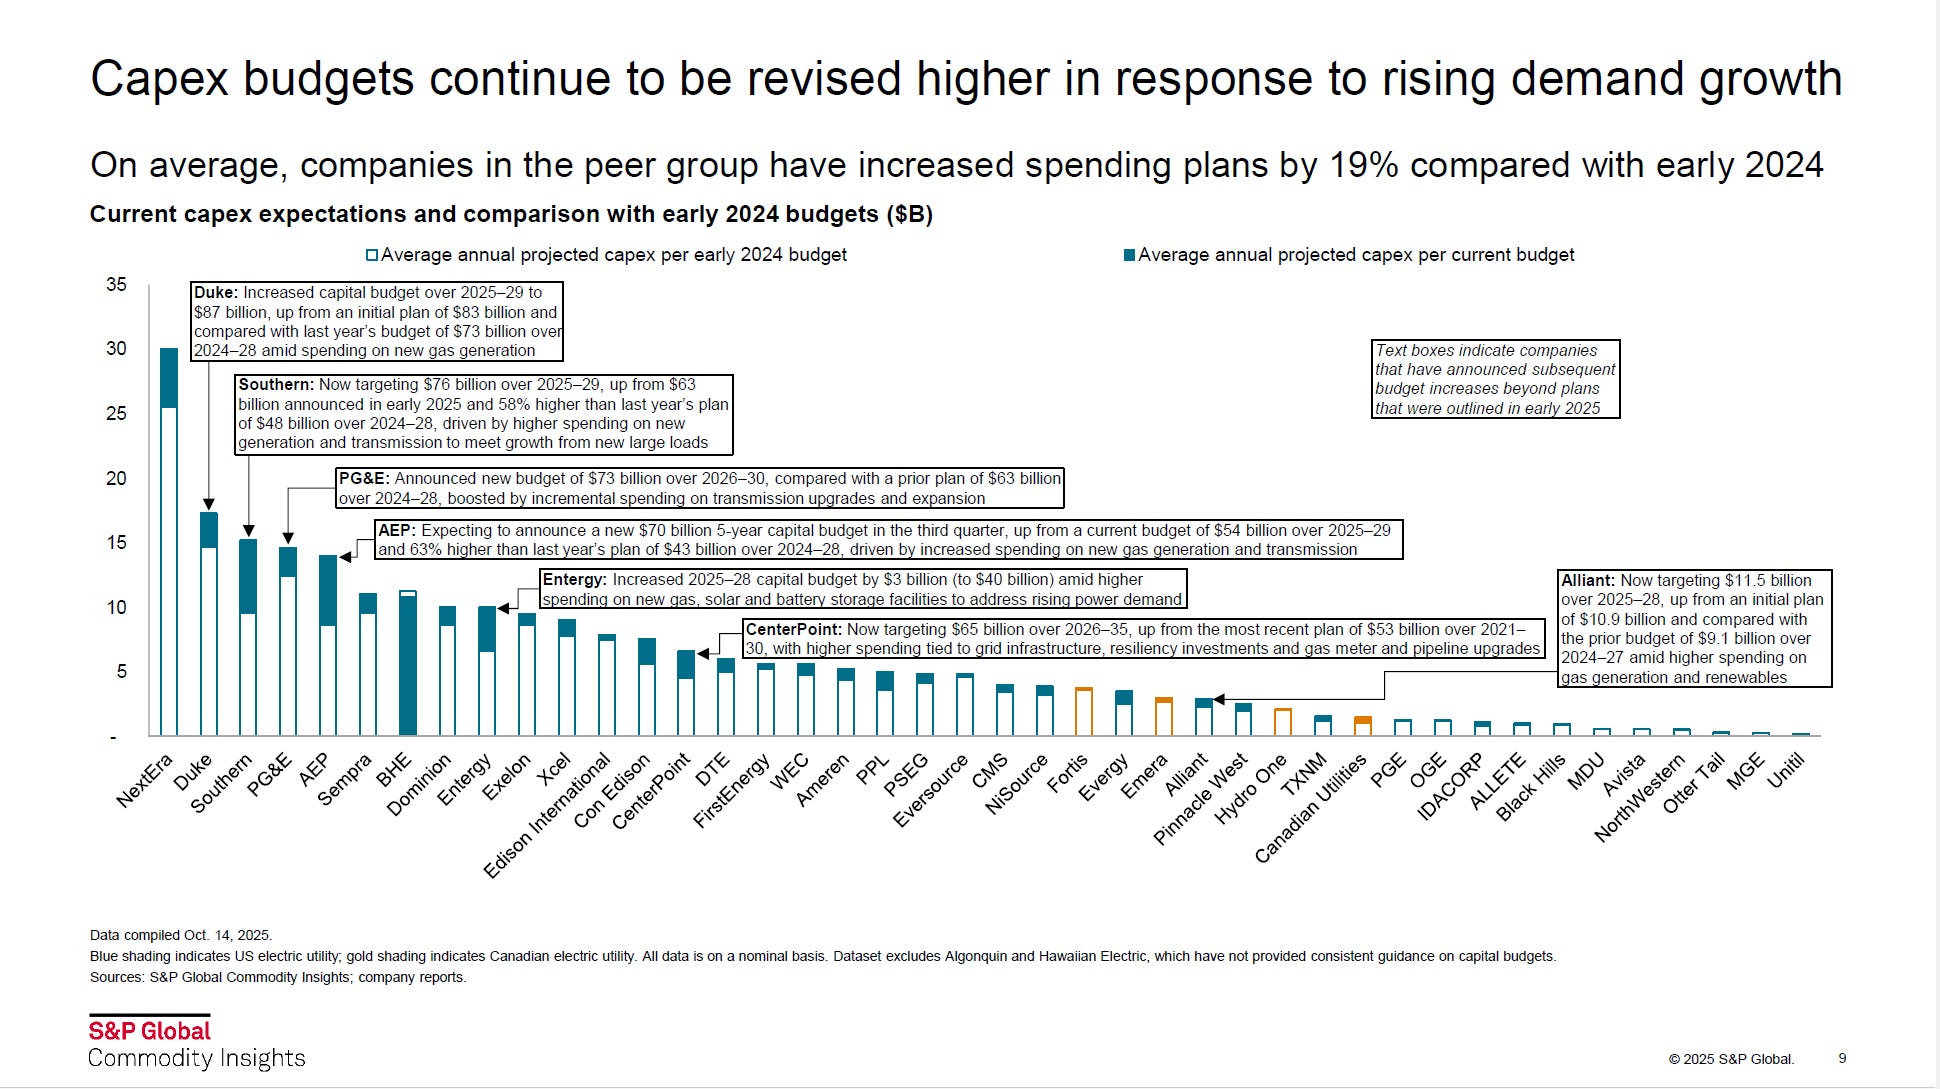
Demand Growth is a Huge Driver of Capex
Utilities have increased their spending plans by 19 percent compared to forecasts from early last year. The graph below shows the increase in capital spending for the utilities covered in the report.
Duke Energy has upwardly revised its capital plans several times in the last few years, with the latest revision seeing the utility potentially spending $100 billion in the coming years. Much of the new spending is targeted at meeting load growth, with gas generation and transmission cited as common reasons for rate increases.
Where’s the Money Going?
Capex in transmission and distribution is rising as a share of overall spending, along with renewables and storage, which are projected to account for 19 percent of overall capex in the next five years.
The graph below also shows non-renewable generation has been falling as a percentage of capex from 2014-2024, a critical component that
...This excerpt is provided for preview purposes. Full article content is available on the original publication.