The Rate of Change: July 15, 2019
Millennia from now, if there’s one piece of data that humans alive today will be known for, I think it would be this.
Carbon Dioxide Levels over the Past 10,000 Years

Image modified from the Keeling Curve
This graph shows us the historical record of carbon dioxide levels in Earth’s air, over the last 10,000 years. For most of this time, carbon dioxide levels were quite stable — that’s the relatively flat portion of the graph. Agriculture, cities and civilizations all got their start somewhere along those gentle slopes. This stability coincided with the moderate climate following the last ice age, which ended around 15 thousand years ago.
All the way on the top right, that dramatic spike is where we find ourselves today. The last time that carbon dioxide levels were as high as they are today was about 3 million years ago. Back then, global temperatures were 3 degrees Celsius warmer, and sea levels were about 20 meters (66 feet) higher.
(This classic XKCD comic explainer provides an excellent timeline of Earth’s temperature from the last ice age to the present day. By taking this long view, we can understand how unprecedented our current moment is.)
You might think that the carbon crisis is a historical problem, because we’ve been burning fossil fuels for hundreds of years. But take a look at this.
Carbon Dioxide Levels over the Past 10,000 Years: a Personal, Human-Centered View

Image modified from the Keeling Curve
Here’s an astonishing fact: humans have pumped more carbon dioxide into the air in my lifetime than in the time between my birth and the start of the Industrial Revolution.
If you look at all carbon dioxide added to the atmosphere since the Industrial Revolution, more than half was added after 1990. A quarter was added after 2007. Just 30 years — a single generation — accounts for half of all carbon emissions in the history of burning fossil fuels.
Here, look up your age in this chart created by Neil Kaye, a climate data scientist at the UK’s Met Office. It’ll tell you how big a slice of global fossil fuel emissions have occurred in your lifetime.
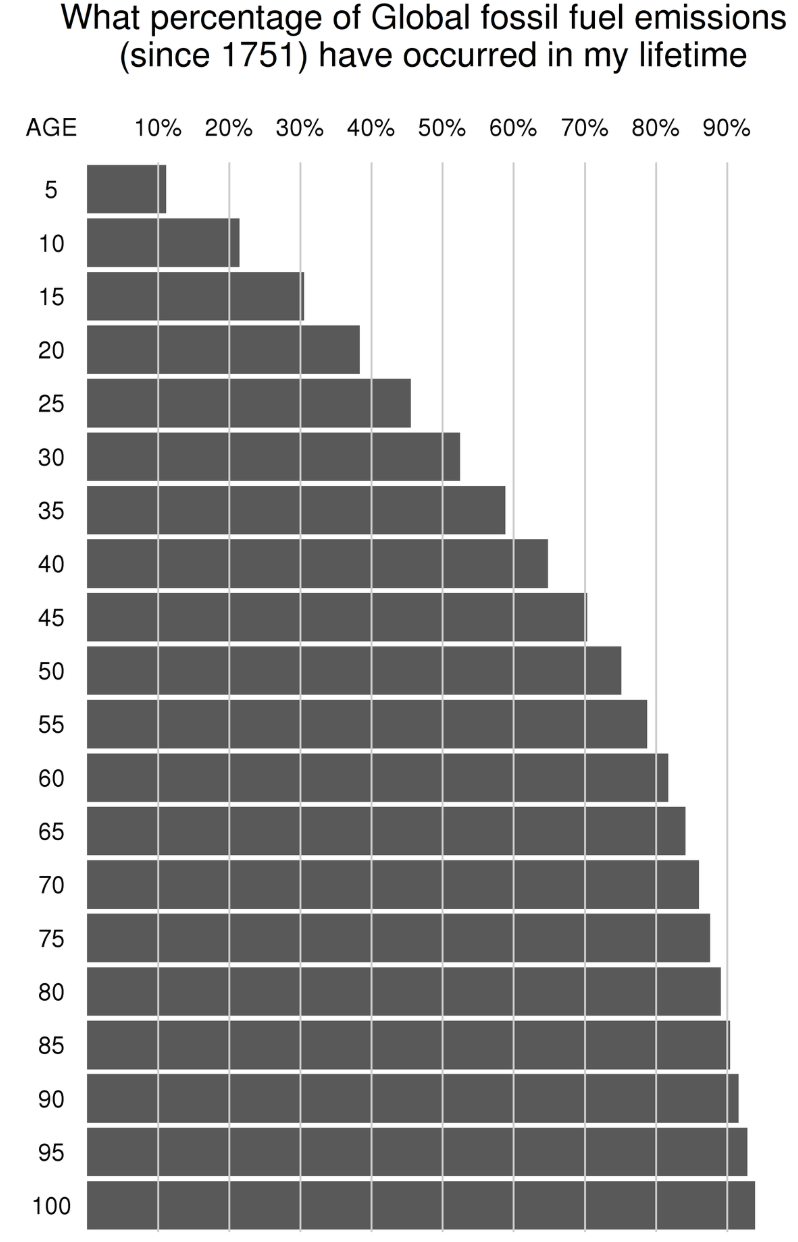
Image source: Neil Kaye, World Energy Data
So this is very much a modern problem.
Let’s zoom in closer to modern times. Here’s all of human industrialization in a graph.
Carbon Dioxide Levels From
...This excerpt is provided for preview purposes. Full article content is available on the original publication.