What voters in every state think about Trump and prices
Deep Dives
Explore related topics with these Wikipedia articles, rewritten for enjoyable reading:
-
Multilevel regression with poststratification
9 min read
Linked in the article (6 min read)
-
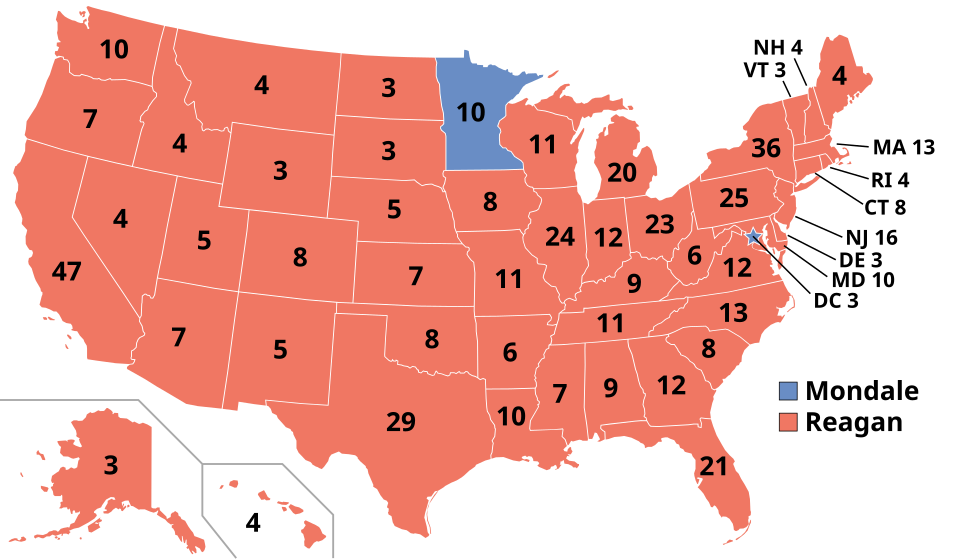
1984 United States presidential election
13 min read
The article directly compares Trump's current approval ratings to the 1984 Reagan-Mondale landslide, calling it a reference point for how bad Trump's state-level numbers look. Understanding the magnitude of Reagan's 49-state victory provides crucial context for interpreting this comparison.
-
Participation bias
11 min read
The technical section discusses 'non-ignorable partisan non-response' (NIPNR) as a fundamental challenge in polling that caused errors in 2016 and 2020. Understanding nonresponse bias helps readers grasp why polling methodology matters and why the author is implementing MRPW techniques.
Support independent, empirical political journalism in 2026
If you find my data-driven political analysis valuable, consider becoming a premium subscriber to Strength In Numbers. Over the last year, I have published dozens of exclusive deep dives that beat other outlets to the punch on everything from Trump’s unpopularity and his losses with young people, to the politics of affordability and Trump’s weakness on deportations. Join now and stay ahead of the curve in 2026.
If you haven’t taken advantage of the holiday coupon yet, you can get 20% off a subscription for next year using the button below. This expires on Jan. 1!
While “off” for my end-of-year “break” (it’s really more like a retreat; I use the time I get back by not writing 3x a week to solve coding problems and catch up on various administrative tasks), I have been making some improvements to the models I run using our monthly Strength In Numbers/Verasight polls. These models transform national polling data into estimates of state-level opinion, which can be very informative and enable more predictive commentary about elections (since elections in America happen at the state, not national, level). Some research suggests these models might also lead to better estimates of subgroup attitudes, rather than just taking crosstabs at face value.
These improvements should, in theory, help solve several hard problems in political polling today, and I have put some details about them at the end of this article. But today I want to write more about the results than the process, so let’s dig into the data:
The big story is this:
A -16 national net approval is a landslide electoral defeat
By now, we should all know that Donald Trump is very unpopular nationally, but what does that mean at the state level?
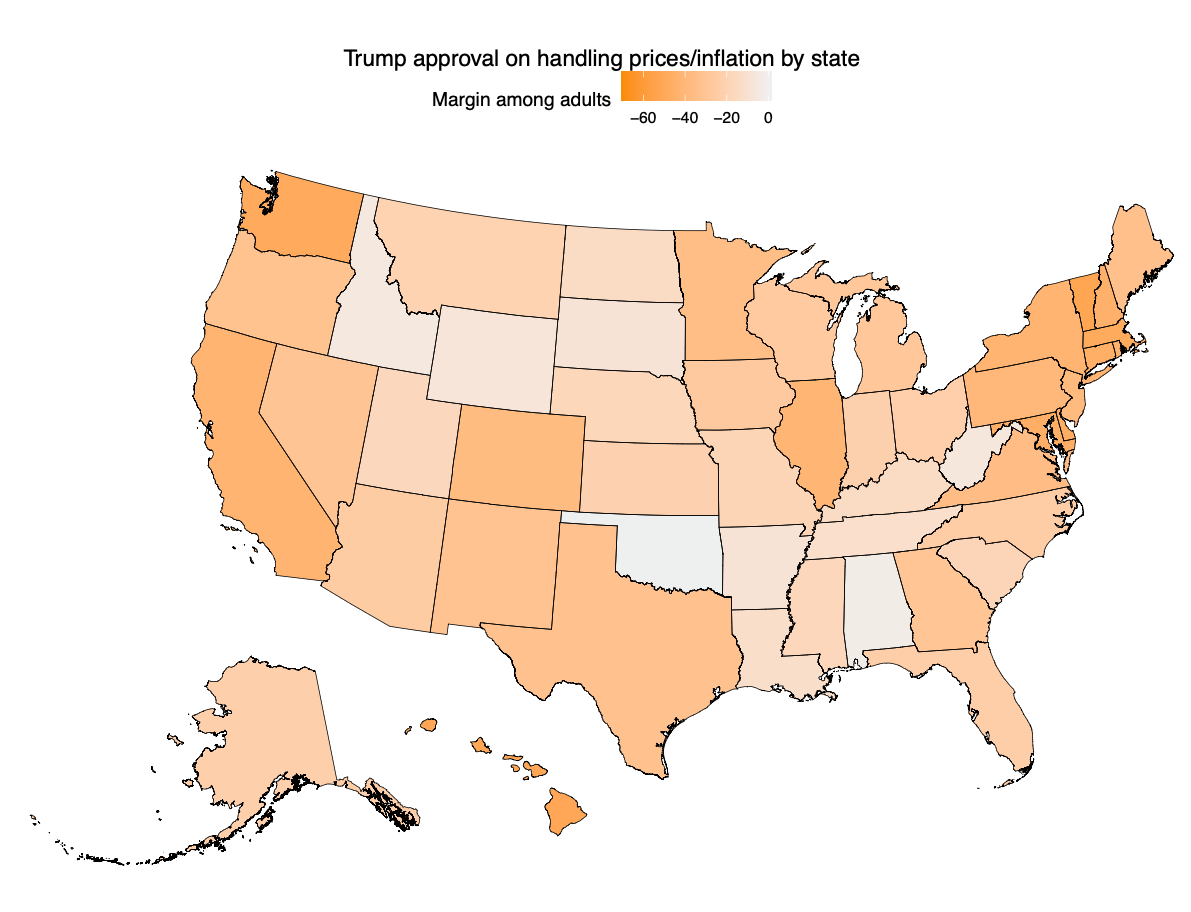
The charts below show estimated Trump approval (a) overall and (b) for his handling of inflation, for each state, combining all the interviews we conducted in 2025 (from May through November). Trump’s approval overall among adults is pretty abysmal (positive in just 11 states), but it’s downright catastrophic on inflation; Trump’s only positive rating is in Oklahoma.
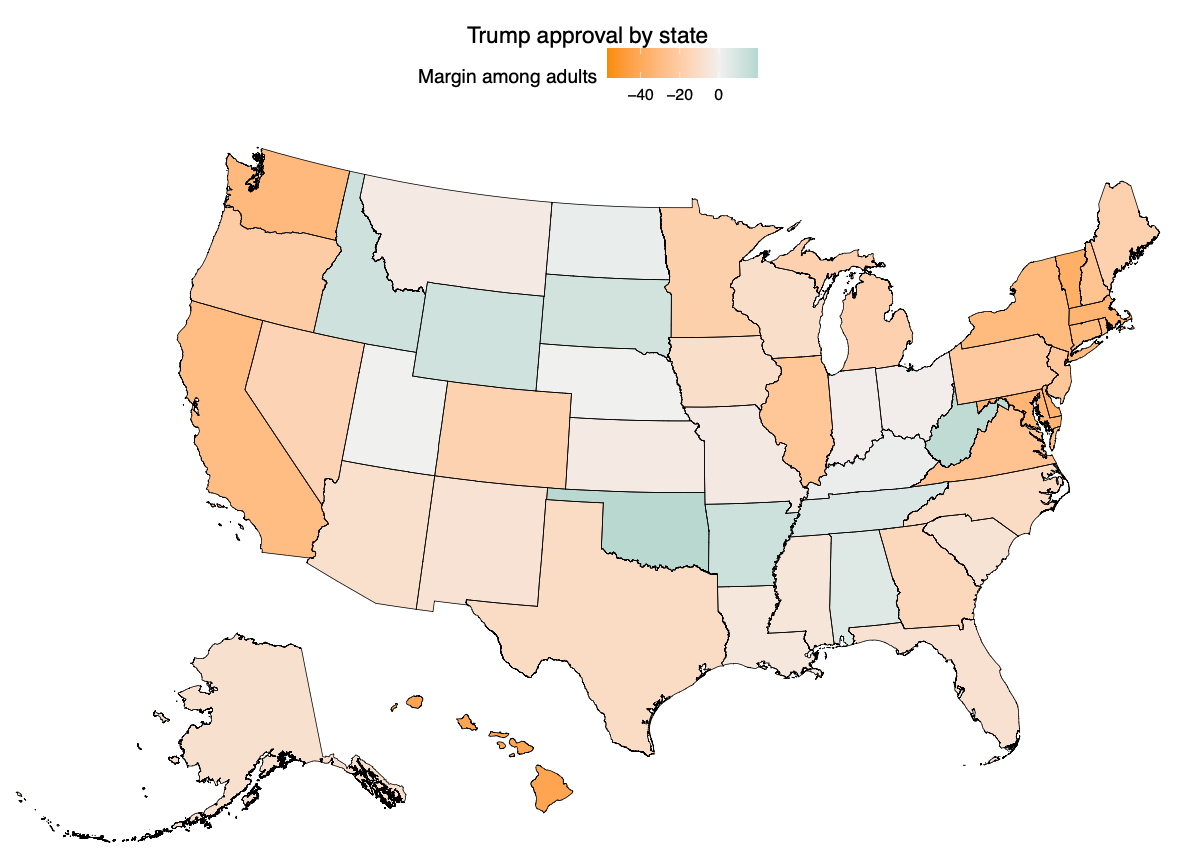
To really underscore just how bad this is, consider that these maps look less like the results of the 2024 presidential election than the results in 1984, when Walter Mondale lost by 18 points to Ronald Reagan nationally:
And as
...This excerpt is provided for preview purposes. Full article content is available on the original publication.