Housing and Affordability – No Easy Solutions
Deep Dives
Explore related topics with these Wikipedia articles, rewritten for enjoyable reading:
-
Metropolitan statistical area
11 min read
Linked in the article (6 min read)
Thank you for reading our work! Nominal News is an email newsletter read by over 4,000 readers that focuses on the application of economic research on current issues. Subscribe for free to stay-up-to-date with Nominal News directly in your inbox:
If you would like to support us in reaching our subscriber goal of 10,000 subscribers, please consider sharing this article and pressing the like❤️ button at top or bottom of this article!
Solving the problem of housing affordability is one of the top social issues. One often-touted solution is removing various supply constraints on housing such as zoning and building regulations. Theoretically, it sounds like such a policy change should lead to a fall in house prices and rents. But recent research by Louie, Mondragon and Wieland (2025) (“LMW”) suggests otherwise.

Supply Constraints
LMW set out to answer the following question – can housing supply constraints, such as zoning laws and other regulations, explain the observed house price and house quantity differences between cities (more specifically, metropolitan statistical areas) in the US. It is commonly believed that the reason certain cities are ‘more expensive’ is that it is much harder for new housing to be built in them due to onerous regulations.
To test this hypothesis, LMW decided to look at how housing supply in a city reacts to changes in housing demand. If something causes housing demand in an area to go up (for example, new job opportunities), we can look at how the quantity and price of housing change in response to this ‘demand shock’. In cities where it is ‘easier’ to build, housing quantities should go up by more and prices should not rise as much as in cities where it is ‘harder’ to build. Visually, this would look like this:
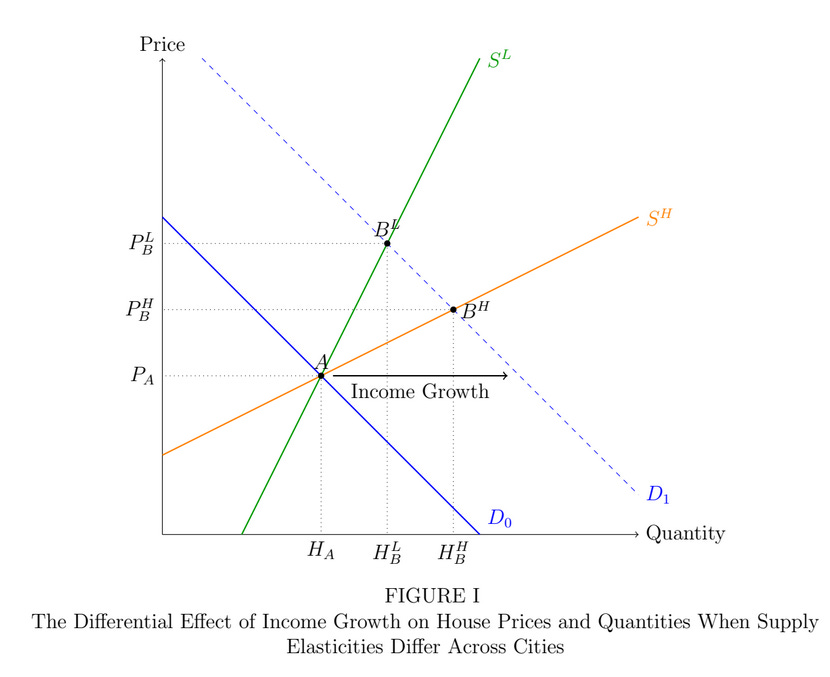
Here we can see the standard supply-demand graph – with price on the y axis and quantity on the x axis. If something such as income growth or better jobs causes a shift in demand (from line D-0 to line D-1), in ‘easy’ to build cities (denoted as orange S-H), we’d be at point B-H (from point A). In ‘difficult’ to build cities (green S-L), we’d be at B-L.
Looking at these shocks to housing demand, we can figure out what the slope of the supply curve looks like – the flatter it is, the more
...This excerpt is provided for preview purposes. Full article content is available on the original publication.