Comparing climate models with observations
Deep Dives
Explore related topics with these Wikipedia articles, rewritten for enjoyable reading:
-
Special Report on Emissions Scenarios
12 min read
Linked in the article (15 min read)
-
Coupled Model Intercomparison Project
11 min read
The article extensively discusses CMIP3, CMIP5, and CMIP6 model generations but assumes reader familiarity with what CMIP actually is. Understanding the history, methodology, and international coordination behind these model comparisons provides essential context for evaluating the article's analysis.
-
Climate sensitivity
14 min read
The article references 'hot models' with high climate sensitivity (>5C per doubling CO2) and transient climate response filtering, but doesn't explain what climate sensitivity means or why it matters. This concept is fundamental to understanding why different models produce different warming projections.
The extreme global temperatures of the past few years have led a lot of people to ask me if the world is warming faster than expected.
To answer that, we need to look at how well climate models reproduce observed global mean surface temperatures. Here I will look at the last three generations of climate models (CMIP3, CMIP5, and CMIP6) as well as a version of the latest generation of models (CMIP6) that excludes the so-called “hot models” whose climate sensitivity is higher than the range deemed likely in the most recent IPCC report.
It turns out that that the resulting picture is complex. Earlier generations of models better reproduce the rate of warming observed since 1970, while the latest generation better captures the rate of warming in the last two decades. Whether this is evidence that warming is occurring faster than earlier generations of climate models expected will depend on how much of the recent warming acceleration is here to stay, and how much is being driven by short-term climate variability. While a bit unsatisfying as an answer, it probably remains too early to tell.
This post represents an update of my 2023 TCB post on model-observation comparisons, albeit with a fair bit of new analysis included (and two more years of observations!).
Comparing warming over time
One classic way to compare models and observations is to look at how temperatures have changed over time, compared to the multi-model mean and 5th to 95th percentile range across individual climate model runs. This is generally done using a single run for each unique climate model (in cases where modeling groups submit more than one modeling run) in order to ensure that each gets equal weight in the analysis.
For example, here are the 23 unique CMIP3 climate models that accompanies the IPCC 4th Assessment Report published in 2007. These models were run around 2004, and use historical data on CO2 concentrations, volcanoes, and other climate forcings through the year 2000 (and the SRES scenarios thereafter, with the middle-of-the-road A1B scenario shown here).
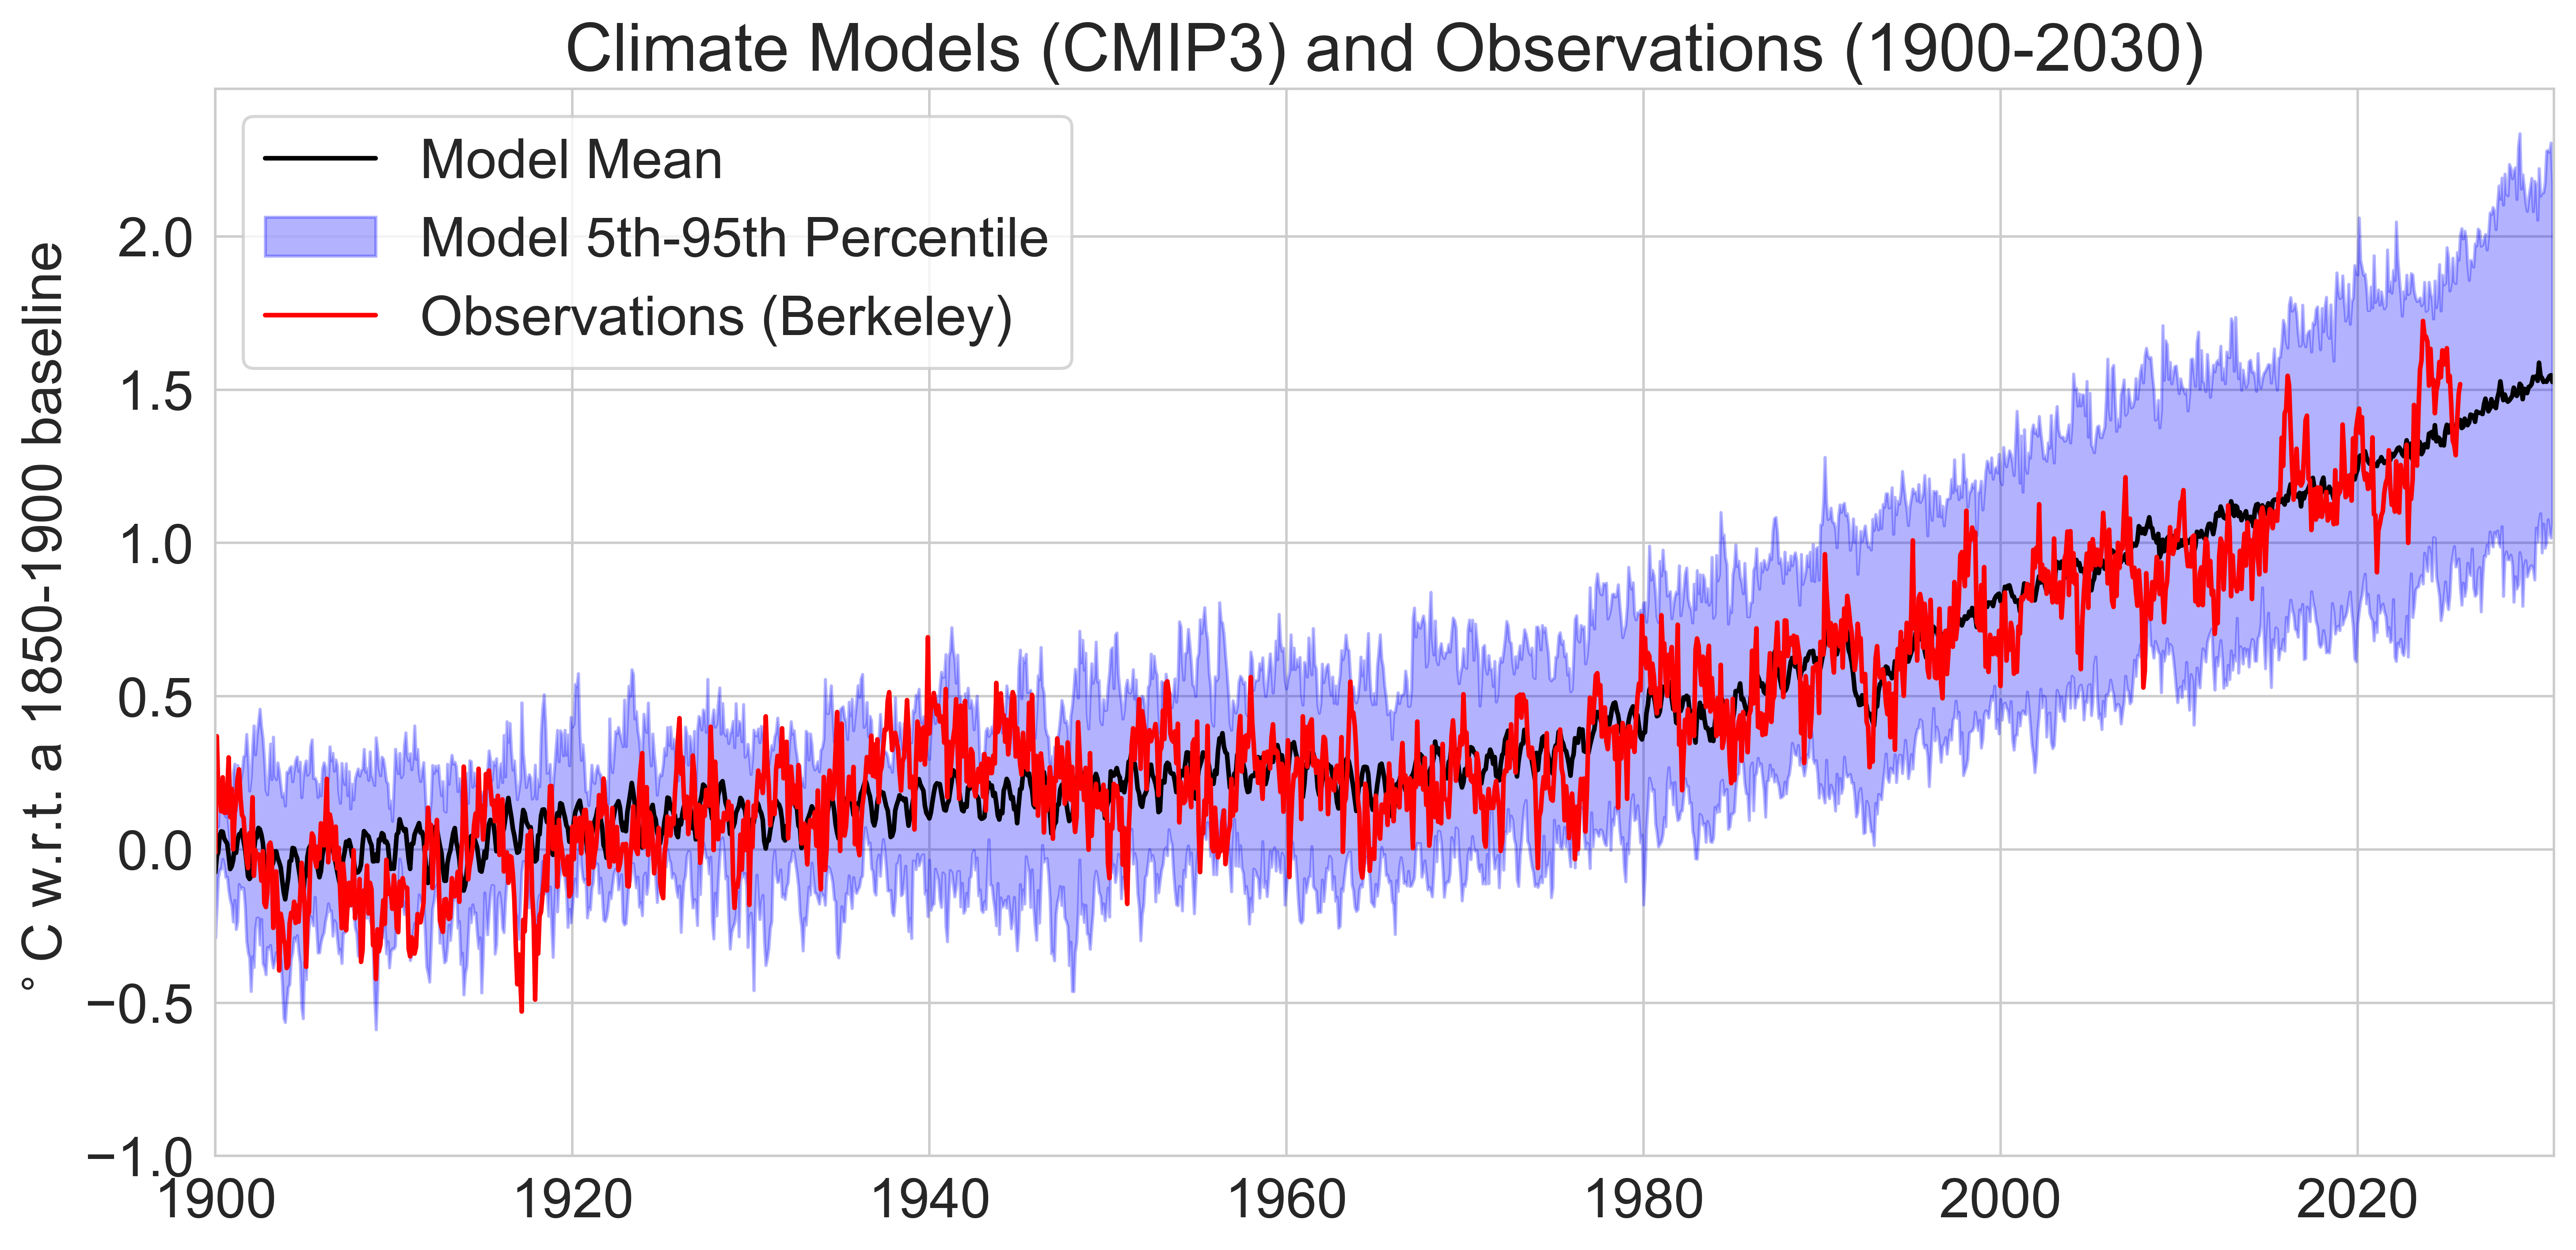
These are compared to observations from the Berkeley Earth surface temperature product on a monthly basis, and generally show quite a good agreement over the past century, with observations close to the multi-model mean except for a brief period in the 1900s and 1940s.
We can zoom into the more recent post-1970 period when the
...This excerpt is provided for preview purposes. Full article content is available on the original publication.