The Top Eight Takeaways from the Lawrence Berkeley/Brattle Factors Influencing Electricity Prices Study
In mid-October 2025, Lawrence Berkeley National Labs (LBNL) and the Brattle Group released a study called “Factors Influencing Recent Trends in Retail Electricity Prices in the United States.”
Several of our readers reached out to us for our perspective, so here are our thoughts on the most interesting slides from their presentation and some light commentary on each of them that may turn into longer articles in the future.
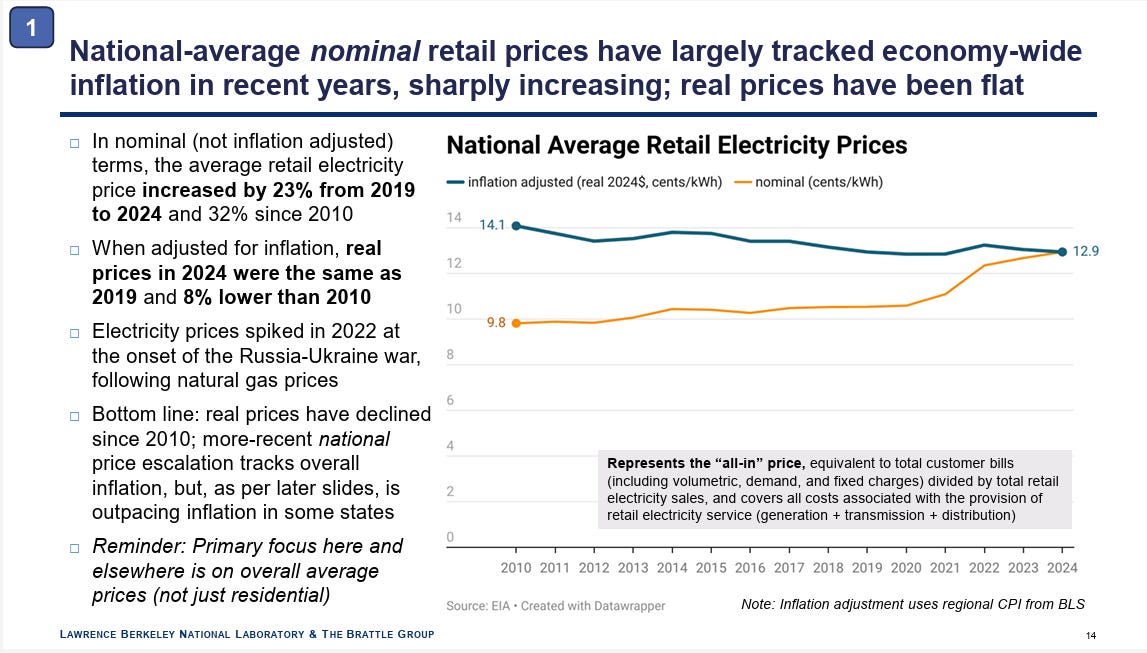
1. Electricity Prices are Up 23 Percent Since 2019, Up 32 Percent Since 2010
LBNL and Brattle show graphs depicting the cost of electricity increasing 32 percent, in nominal terms, since 2010 and up 23 percent since 2019. The graph also shows that inflation-adjusted power costs have fallen since 2010 and were the same as in 2019.
It feels like there is a movement by wind and solar advocates to explain away rising nominal power costs by simply blaming it on general “inflation.” However, we have a pet theory that merely adjusting electricity prices for inflation when looking at trends in cost-of-service areas oversimplifies the issue of rising electricity prices, because much of this system of utility regulation is inherently deflationary—especially during times of low load growth, when new resources aren’t required to meet rising demand.
Our reasoning is that much of the capital spent on the power plants currently on the system was deployed decades ago, and the depreciation costs on existing plants aren’t subject to the inflationary pressures, except for the revenue requirement and rate of return.
The only capital subject to rising prices has been on new builds, and while some of these new builds are required in the natural course of replacing old generators, the vast majority of new capacity in recent years has been to meet state mandates for renewable energy or carbon emission reductions—not to meet rising demand.
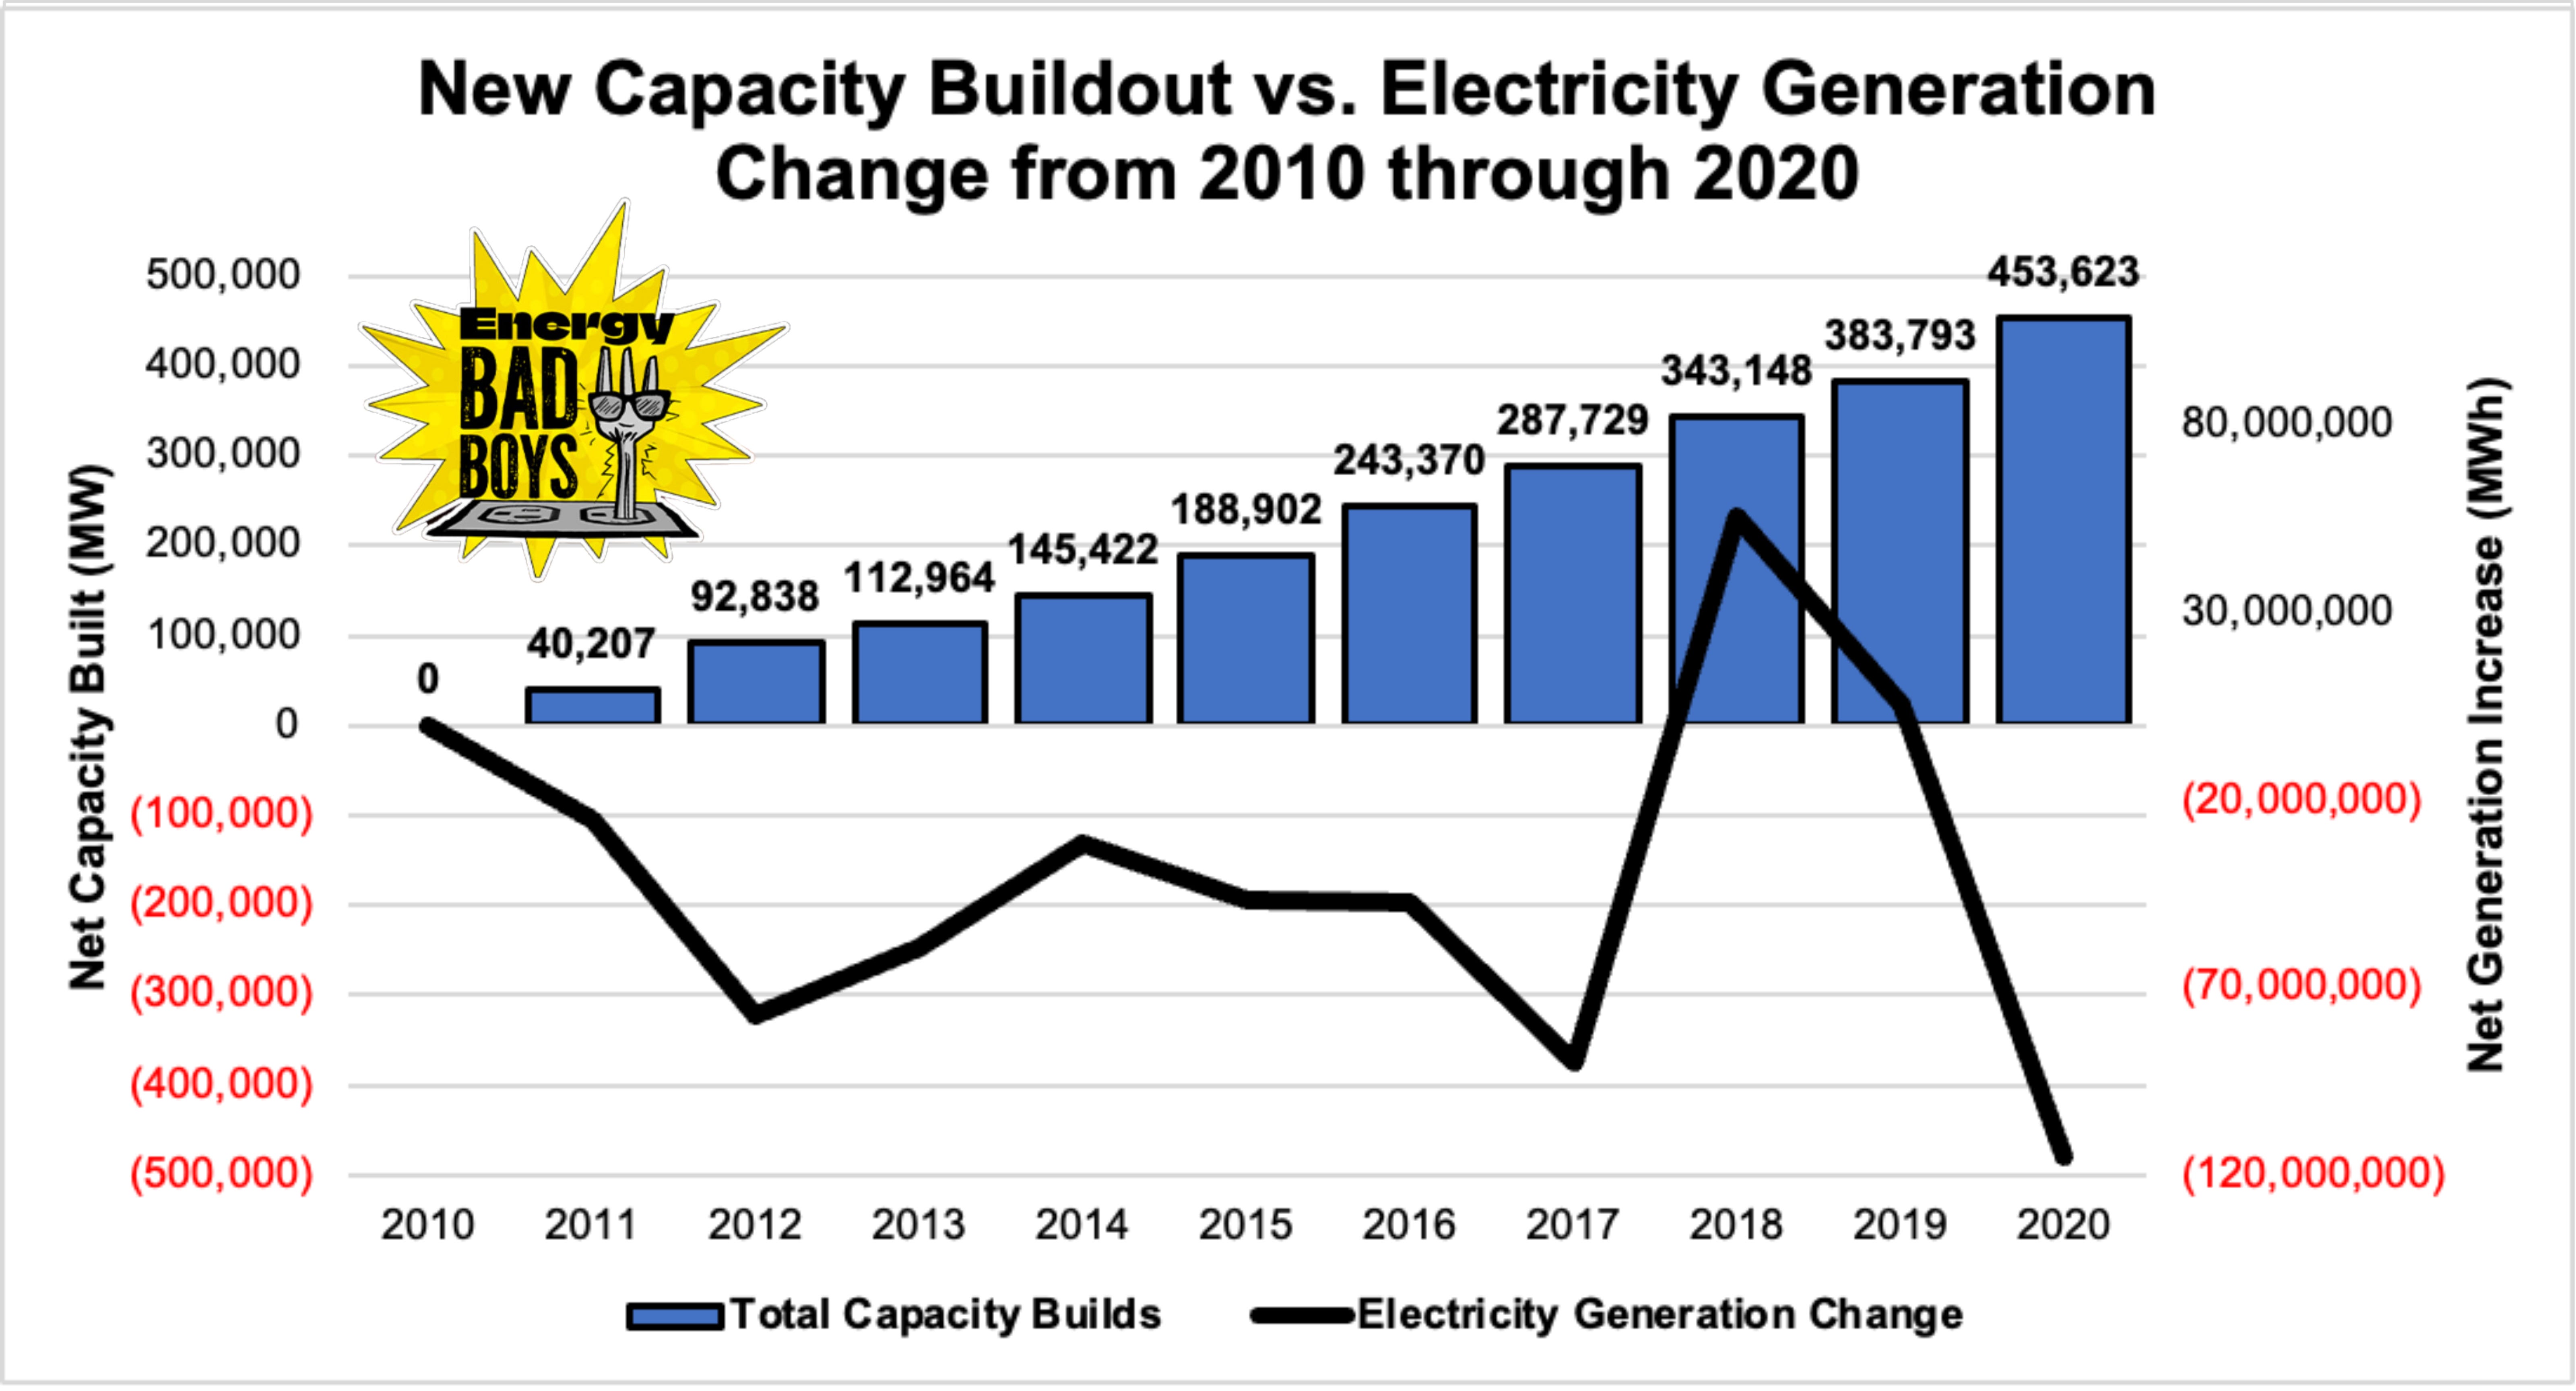
As you can see from the chart below, from 2010—2020, the U.S. electric grid built over 450,000 megawatts (MW) of new capacity even though generation was relatively flat or falling during the same period. Roughly half of these builds were wind and solar, while another 40 percent were natural gas facilities used to replace coal plants that were retired prematurely. By explaining away rising prices on inflation, one misses the fact that prices could’ve been even lower without this massive buildout of power facilities during a time of stagnate demand growth.
That leaves fuel,
...This excerpt is provided for preview purposes. Full article content is available on the original publication.