"I'm Not Happy About Our Growth"
Deep Dives
Explore related topics with these Wikipedia articles, rewritten for enjoyable reading:
-
Employee stock option
16 min read
The article emphasizes that stock-based compensation at 12% of revenues significantly impacts Airbnb's true profitability, and understanding how SBC works as a non-cash expense that still dilutes shareholders is crucial for interpreting the EBIT vs EBITDA distinction the author highlights
-
Enterprise value
11 min read
The article uses EV/EBIT multiples as the primary valuation metric and specifically calls out that many websites miscalculate this due to share count errors - understanding enterprise value calculation provides essential context for the valuation analysis
-
Two-sided market
13 min read
Airbnb operates as a classic two-sided marketplace connecting hosts and guests, and understanding platform economics explains why growth in 'expansion markets' matters so much and why the company faces the strategic challenges described in scaling globally
From “More Than A Place To Stay” (May 2025): “The net result is low-single digit FY25e operating income (EBIT) growth. At ~$138 per share, or an enterprise value of ~$81 billion, ABNB trades at ~31x FY25e EV/EBIT. It seems Mr. Market remains somewhat willing to look past these near term questions. It’s a conclusion that I can appreciate, but one I also suspect could be subject to change under the right scenario - specifically, if volumes and rates in the core U.S. business come under pressure… I continue to watch this situation with much interest – but I’ll remain on the sidelines for now.”
Airbnb’s Slowing Growth
The following two charts are a good jumping off point for the tussle between ABNB bulls and bears (this quarterly data was first disclosed in Q1 FY23).
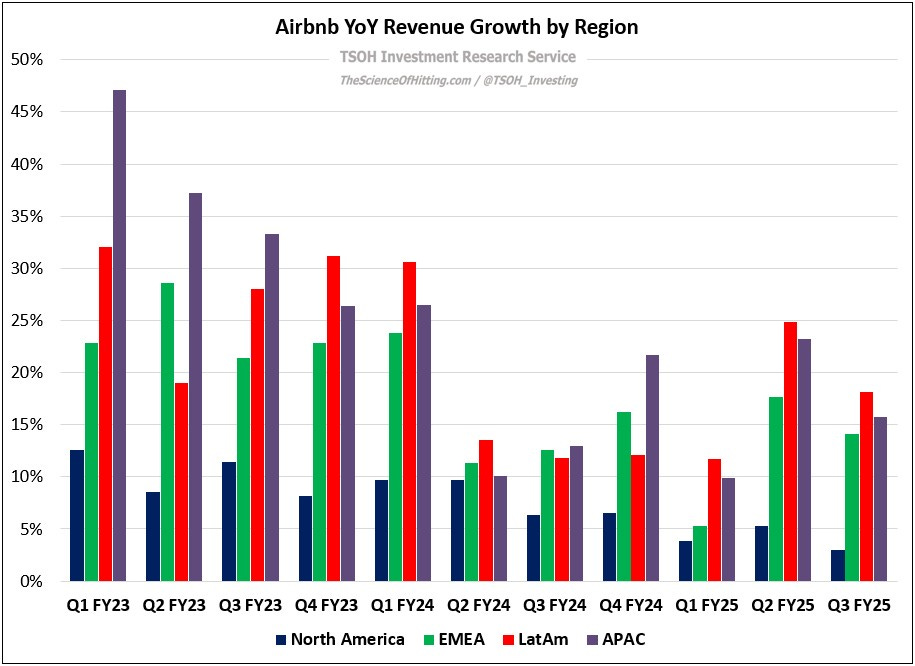
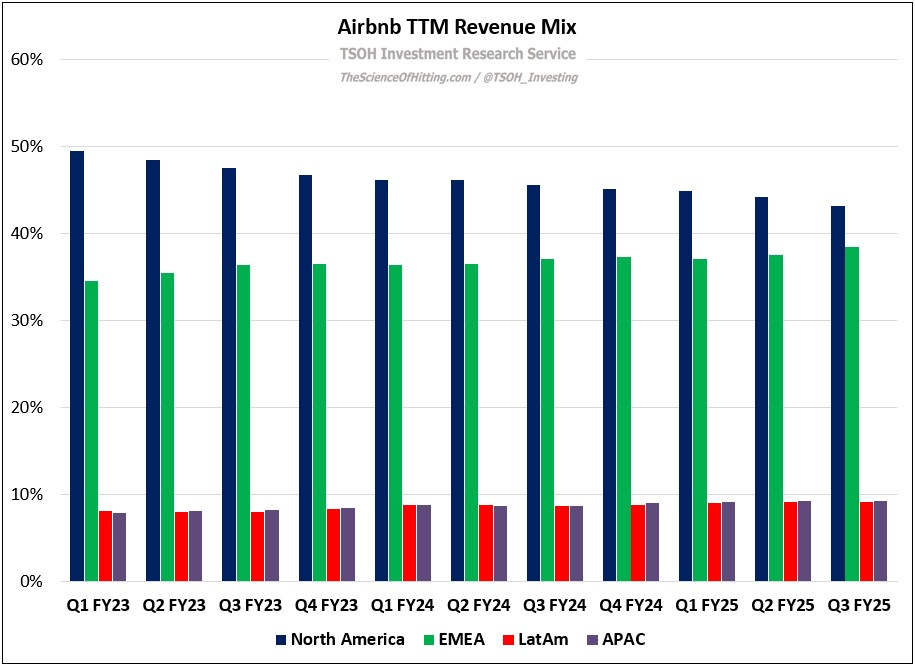
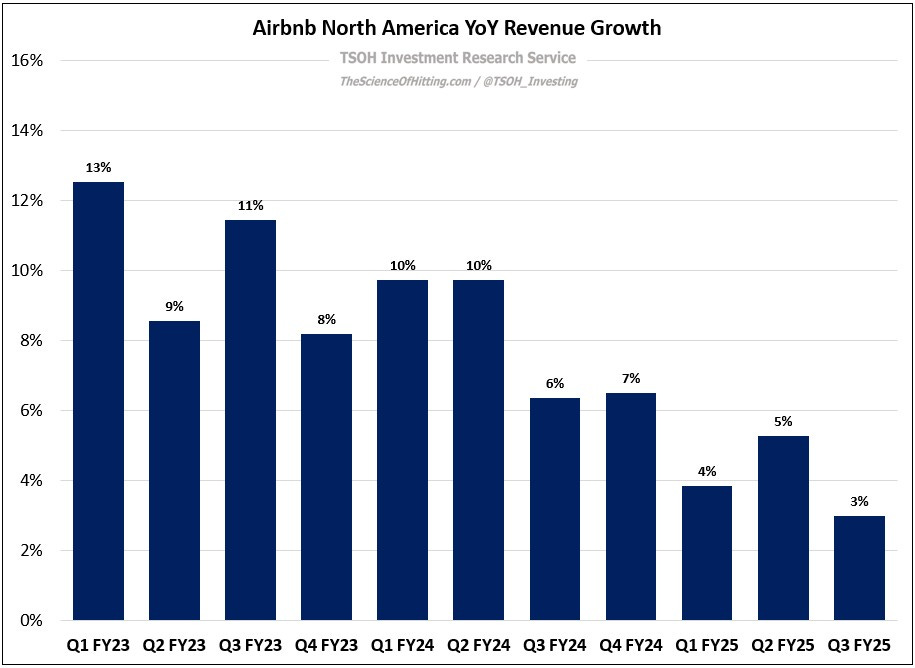
Despite meaningful progress on its global expansion efforts, as evidenced by the >2x higher growth rate for nights booked in expansion markets versus their five primary markets, North America and Europe still account for ~43% and ~38% of TTM revenues, respectively. The pressure on North America has continued, with revenue growth decelerating to just ~3% YoY in Q3 FY25.
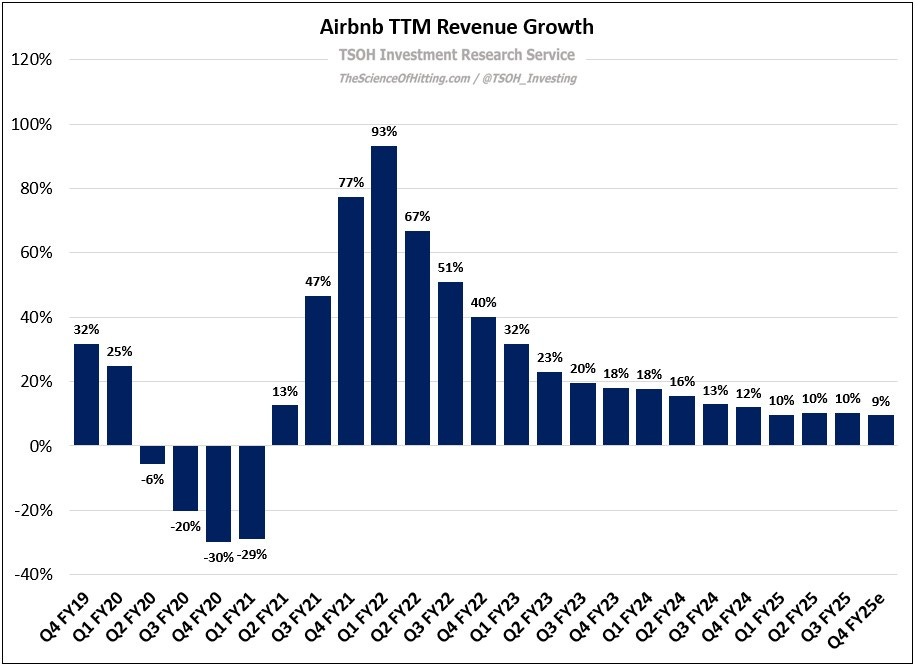
With ~40% of Airbnb’s business now growing low-single to mid-single digits, mid-teens growth for the other ~60% of the pie results in consolidated YoY revenue growth that’s fighting to stay in the double-digits: as shown below, management’s guidance implies TTM revenues will be +9% YoY in Q4 FY25.
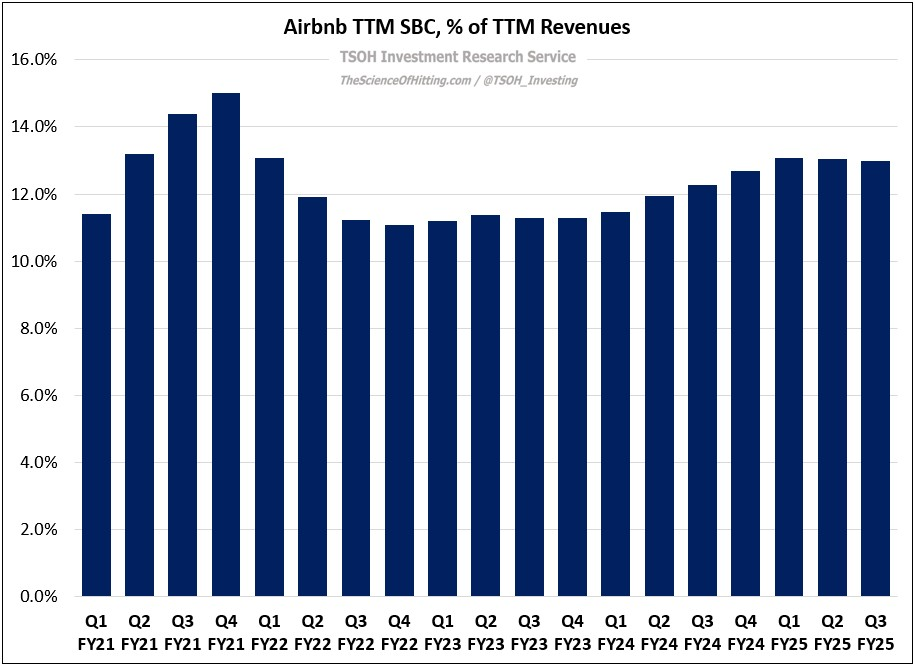
The other challenge is near term pressure on profit margins, which has arisen as a result of expansion market mix shift and the impact of investments to support the company’s strategic growth initiatives, which management has previously pegged at ~$200 million in FY25e, or nearly 2% of revenues. As you can see below, FY25e guidance implies EBIT margins of ~21% - down roughly 400 basis points from the ~25% reported in FY23. Unlike the EBITDA metric that management provides, this accounts for the impact of stock-based compensation - an expense line that is currently at ~12% of TTM revenues.
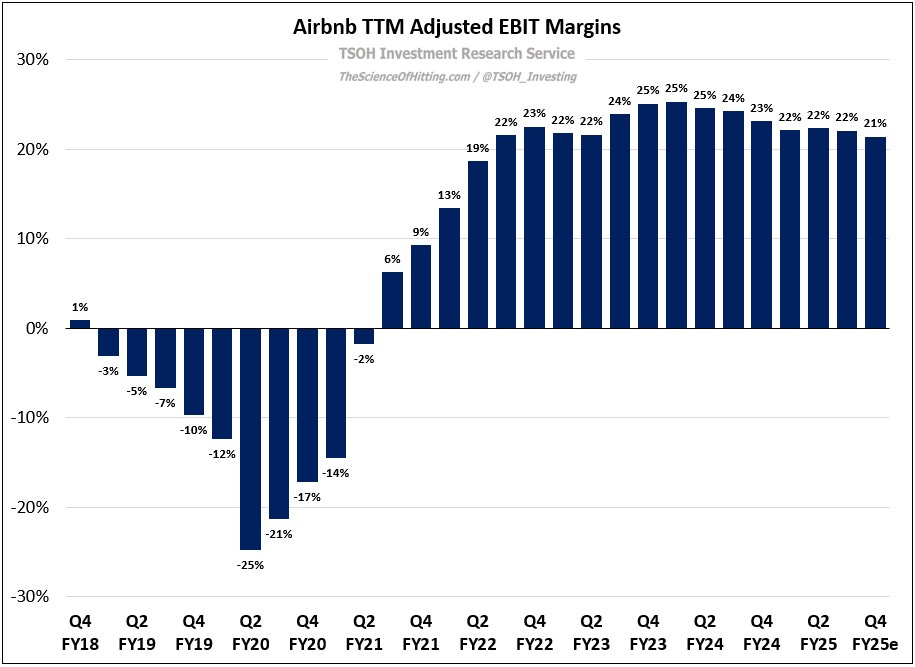
The net result of the above – slowing revenue growth rates and EBIT margin compression – is ~1% FY25e operating income growth, to ~$2.6 billion. As the multiple has come in, to ~25x FY25e, I think Mr. Market is expressing some concern about what that equation will look like in the year(s)
...This excerpt is provided for preview purposes. Full article content is available on the original publication.