The Seshat Databank: Mining 10,000 Years of History
The ambition to transform history into a science has always faced a fundamental obstacle: the lack of systematic, comparable data across different societies and time periods. Historians have traditionally worked with qualitative sources, narratives written by contemporary observers, archaeological remains that reveal fragments of material culture, inscriptions that preserve official declarations, and artistic works that reflect the concerns of their creators. These sources are invaluable for understanding specific societies in their particularity, but they resist the kind of quantitative analysis that transformed fields like physics, biology, and economics into predictive sciences. Each society seems unique, each set of sources idiosyncratic, and the prospect of reducing the rich complexity of human history to numbers appears both impossible and perhaps even undesirable. Yet without quantitative data that can be compared across societies and analyzed statistically, claims about historical patterns remain impressionistic, subject to confirmation bias and selective use of evidence. The question that has haunted scientifically minded historians for generations is whether it is possible to create a systematic database of historical information that would allow rigorous testing of theories about how societies function and change.
The Seshat Global History Databank represents the most ambitious attempt to date to answer this question affirmatively. Named after the ancient Egyptian goddess of knowledge, wisdom, and record-keeping, Seshat is a collaborative project that has assembled quantitative data on hundreds of variables for hundreds of societies spanning more than ten thousand years of human history. The project brings together historians, archaeologists, anthropologists, and data scientists from dozens of institutions around the world, each contributing expertise on particular regions, time periods, or types of evidence. The result is a resource of unprecedented scope and detail, one that makes it possible for the first time to test theories about historical dynamics against systematic evidence from societies across the globe and across the millennia. In this essay, we explore what Seshat is, how it was built, what it contains, how we have accessed and processed it for our cliodynamics replication project, and what challenges and limitations we have encountered along the way.

The origins of Seshat lie in the recognition that progress in understanding historical dynamics requires data that is both broader and deeper than what any individual scholar could assemble. Peter Turchin, whose work on cliodynamics we are replicating in this project, was among the founders, along with Harvey Whitehouse, Pieter Francois, and a team of collaborators at institutions including the University of Oxford, the University of Connecticut, and the Santa Fe Institute. The project began formally in 2011 and has evolved through multiple phases of data collection and release. The dataset we are working with, known as Equinox-2020, represents a major milestone in this evolution, providing time-series data for 373 polities sampled at roughly century intervals from the Neolithic period through the early modern era. A subsequent release, Polaris-2025, has expanded the coverage further, but we focus here on Equinox-2020 as the foundation for our replication work.
Understanding Seshat requires understanding what it means to code historical information. Coding is the process of translating qualitative historical evidence into quantitative variables that can be compared across cases and analyzed statistically. This is not a simple or mechanical process. Consider the question of whether a society had writing. The answer might seem obvious for cases like ancient Rome, which produced vast quantities of written records that survive to the present day, or like the pre-contact cultures of Australia, where writing as such did not exist. But many cases fall in between these extremes. Some societies used mnemonic devices that recorded information but are not quite writing in the conventional sense. Others had writing but restricted its use to specific contexts like religious ritual or royal administration. Still others borrowed writing systems from neighbors but used them only sporadically. Translating this diversity into a binary present or absent coding requires making judgments about what counts as writing and how confident we can be in that judgment given the available evidence.
The Seshat team developed an elaborate coding system to handle these complexities. Rather than forcing coders to choose a single value when evidence is ambiguous, the system allows for multiple types of values that capture different degrees of certainty and different situations. A variable might be coded as present when there is clear evidence, absent when there is clear evidence of non-existence, inferred present when experts believe it was present based on indirect evidence, inferred absent when experts believe it was absent despite lack of direct evidence, unknown when the question cannot be answered given current knowledge, or uncoded when the variable has not yet been evaluated for that society. For numeric variables like population size, the coding can include ranges that express uncertainty about the precise value. All of these distinctions are preserved in the dataset, allowing analysts to take uncertainty into account rather than treating all values as equally reliable.
The process of creating these codes involved extensive collaboration among experts. For each region and time period covered by Seshat, the team identified scholars with relevant expertise and invited them to code the variables for societies in their area of specialization. These codings were then reviewed by other experts, and disagreements were resolved through discussion or documented as disputed values. The entire process was governed by a detailed codebook that specified exactly how each variable should be interpreted and coded, ensuring consistency across different coders and different societies. The codebook itself evolved over time as edge cases revealed ambiguities in the original definitions and as new variables were added to capture aspects of social organization not covered in earlier versions.
The variables in Seshat are organized into several broad categories that reflect different aspects of social organization. Social complexity variables capture features like the number of levels in administrative hierarchies, the population of the largest settlement, and the existence of writing systems and record-keeping practices. Economic variables track features like the presence of markets, the use of money, and the development of specialized crafts and industries. Military variables record information about army organization, military technology, and fortification practices. Religious variables capture features like the presence of moralizing high gods and the institutionalization of religious hierarchies. Political variables track features like the formalization of legal codes and the presence of professional bureaucracies. This comprehensive coverage makes it possible to analyze how different aspects of social organization relate to one another and how they change together over time.
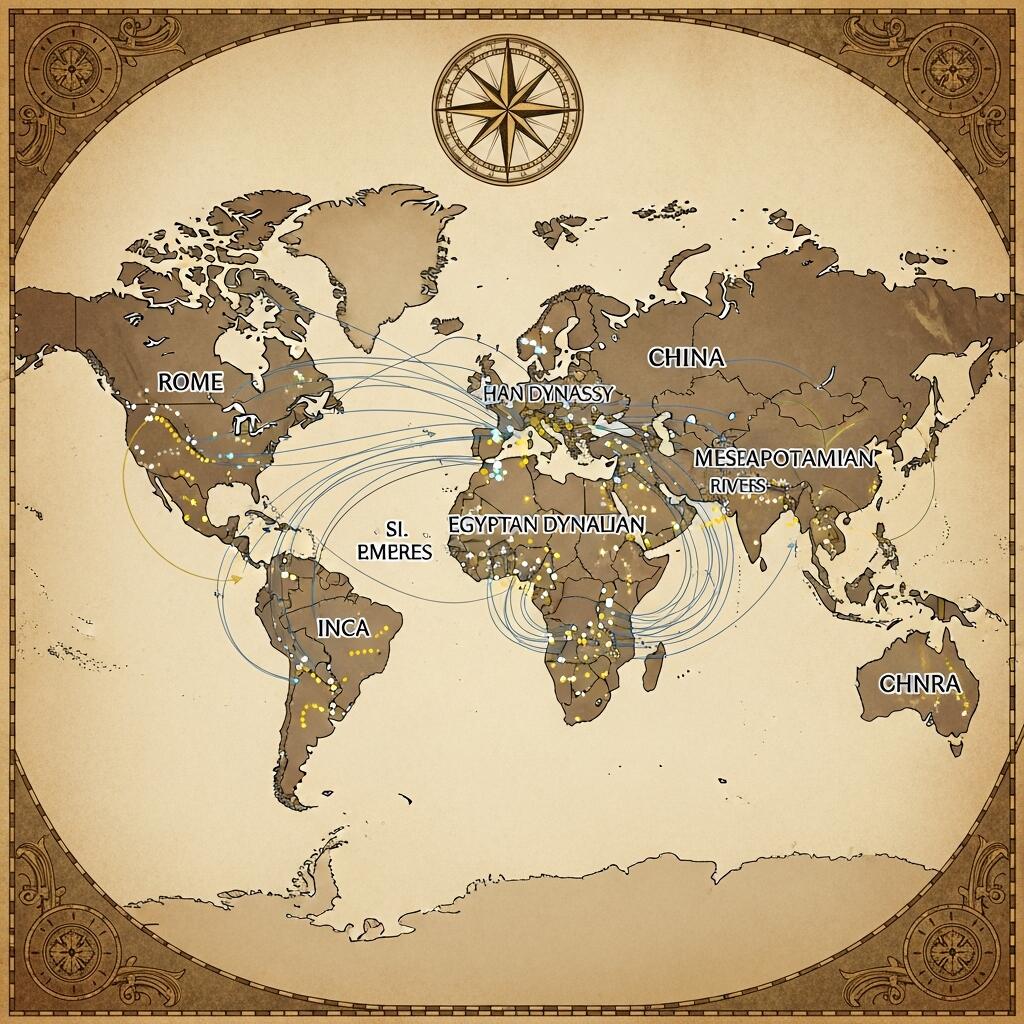
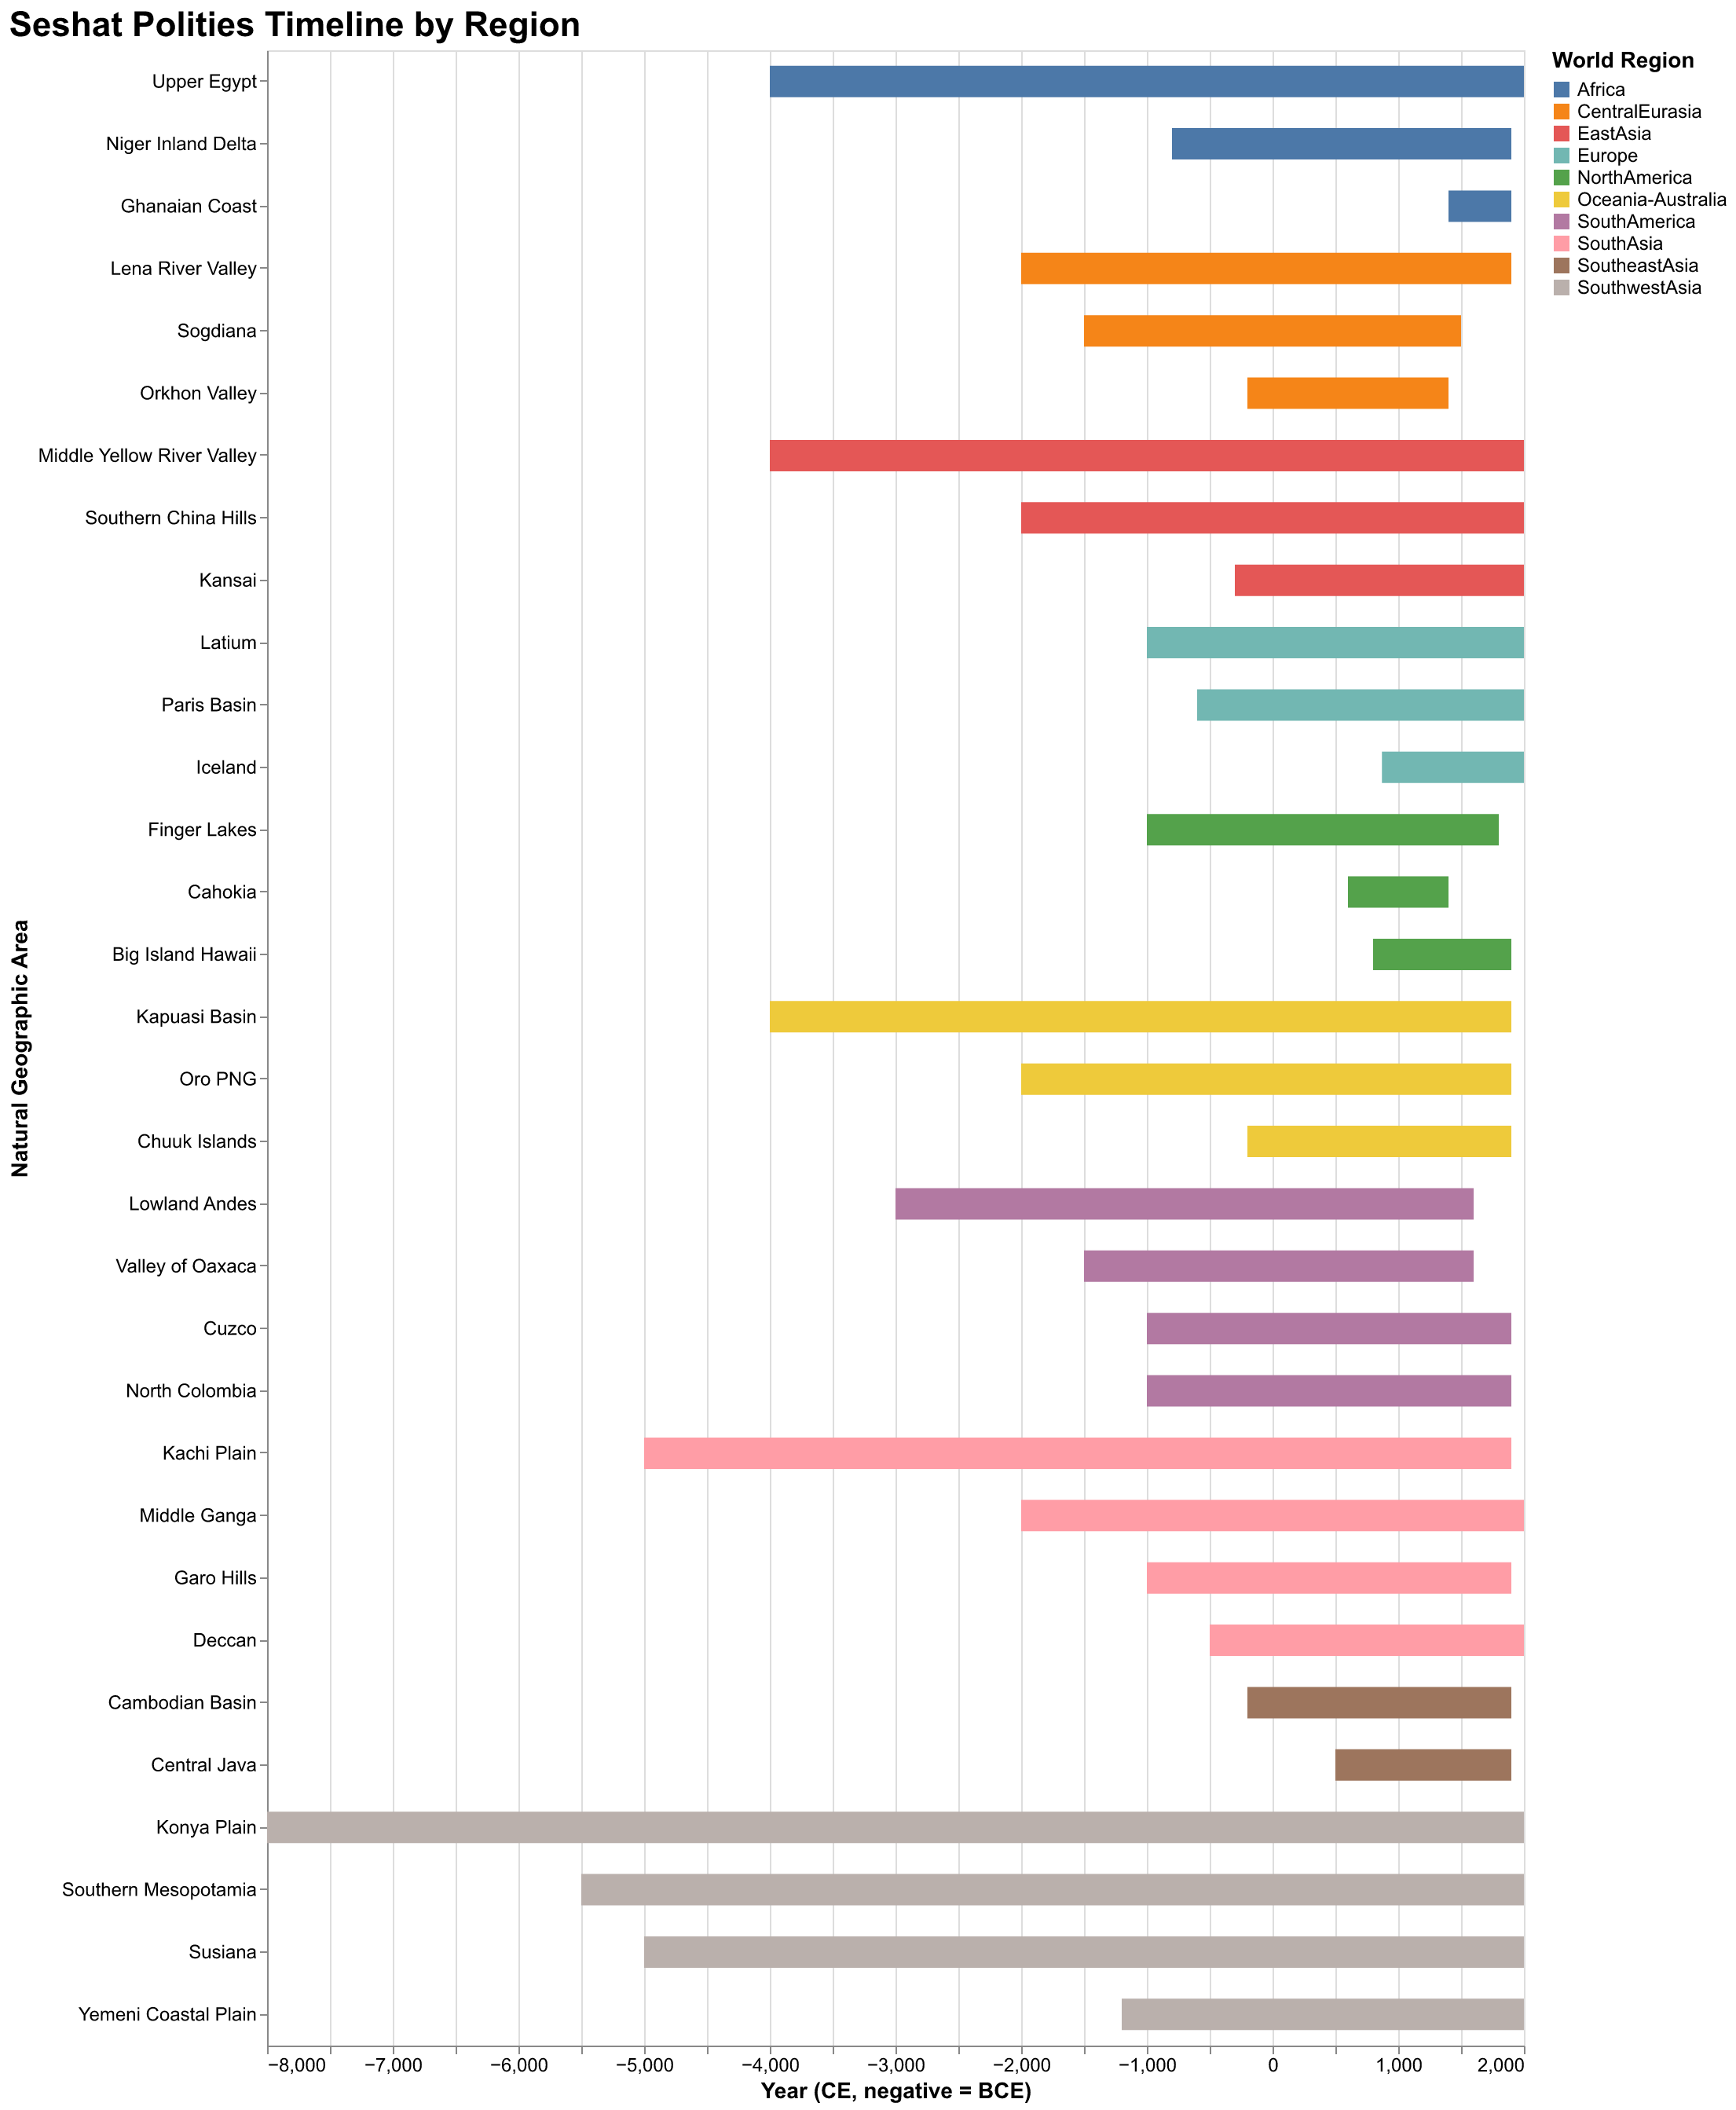
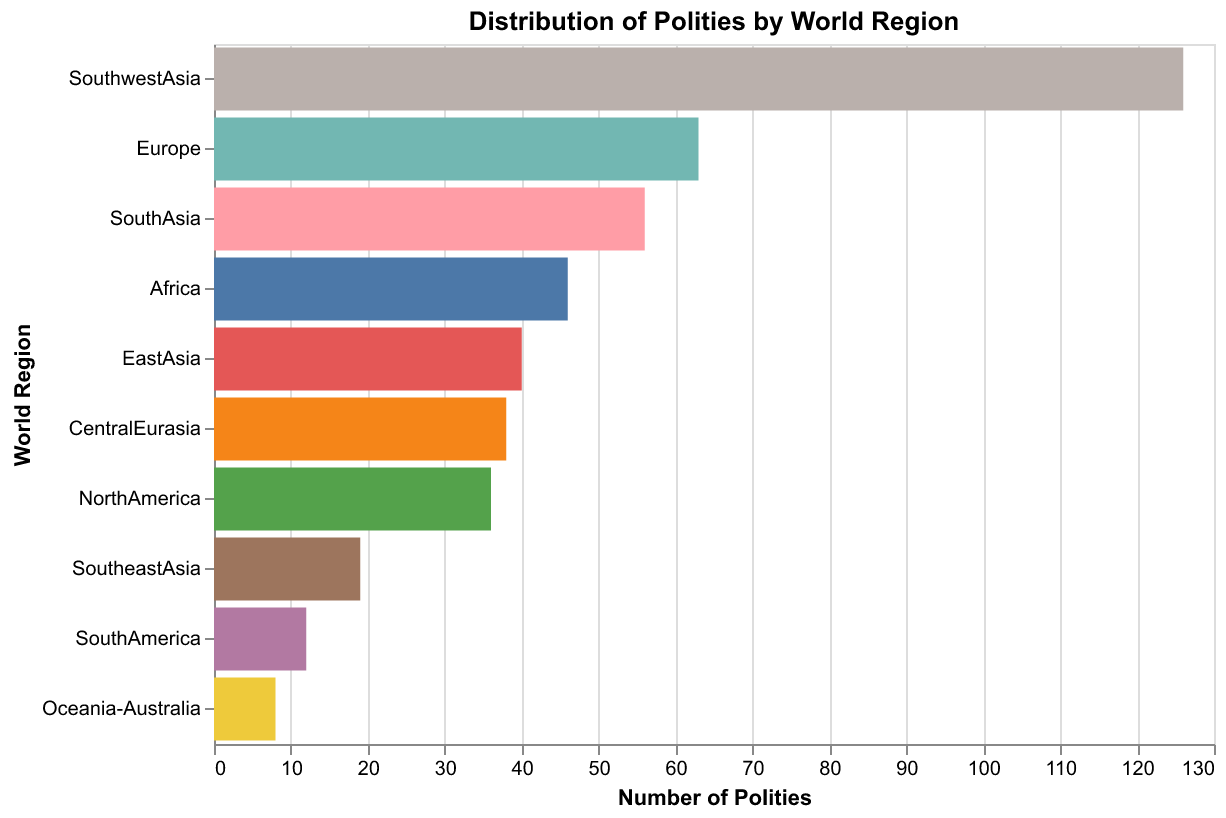
The geographic scope of Seshat deserves particular attention. Rather than organizing data by modern political boundaries, which would impose anachronistic categories on the past, Seshat uses a concept called Natural Geographic Areas, abbreviated as NGAs. An NGA is a region defined by ecological and geographical features that would have been relevant to the societies living there: river valleys, coastal zones, plains suitable for agriculture, mountain ranges that create natural boundaries. The Equinox-2020 dataset includes thirty-five NGAs spanning Africa, Central Eurasia, East Asia, Europe, North America, South America, South Asia, Southeast Asia, and Southwest Asia. For each NGA, the database tracks the succession of polities that occupied it over time, capturing how political organization evolved in response to changing conditions and interactions with neighbors.
The temporal scope is equally impressive. The earliest records in Equinox-2020 date to approximately 9600 BCE, the period of the Neolithic Revolution when agricultural societies first emerged in the Fertile Crescent. The latest records extend to approximately 1900 CE, the threshold of the modern industrial era. This ten-thousand-year span covers the entire history of complex human societies, from the first villages to the vast empires of the pre-modern world. The sampling strategy aims to capture observations at roughly century intervals, though the actual temporal resolution varies depending on the availability of evidence. Well-documented societies like Rome or Han Dynasty China have more frequent observations than less documented societies in regions with sparser archaeological or textual evidence.
The dataset we downloaded for our project is the Equinox-2020 release, which is publicly available through the Zenodo data repository and the Seshat GitHub repository. The data comes in the form of an Excel workbook with multiple sheets containing different views of the same underlying information. The main data sheet, labeled TSDat123, contains time-series observations with one row per polity-century combination. This sheet has 168 columns representing different variables and 1,494 rows representing observations. A separate Polities sheet contains metadata about each polity including its full name, the NGA it belongs to, its temporal bounds, and classifications like world region and complexity level. A Variables sheet describes each variable with its full name, abbreviation, and category. Additional sheets contain supplementary data and documentation.
Let us examine the structure of the main data sheet in detail. Each row represents a single polity at a single point in time. The columns include identifying information like the NGA, polity identifier, and time point, followed by a PropCoded column that indicates what percentage of variables have been coded for that observation, followed by the variable columns themselves. The polity identifiers are short codes that pack substantial information: ItRomPr for Italian Roman Principate, CnHanWe for Chinese Han Western Dynasty, MxAztec for Mexican Aztec Empire. These codes allow efficient reference while preserving information about region and political entity. The time column represents years in the Common Era calendar, with negative values indicating years before the Common Era. Thus an observation at time -500 represents the year 500 BCE, while an observation at time 1200 represents 1200 CE.
The variable columns use a consistent encoding scheme that we needed to understand before we could analyze the data. Numeric variables like population or territory size are stored as floating-point numbers, with the special value negative 999 indicating missing data. Binary presence-absence variables are stored as 1 for present, 0 for absent, and negative 999 for unknown. Some variables have more complex coding schemes with multiple levels representing different degrees of development. Understanding these encodings required careful study of the codebook and examination of actual values in the data. We found that the negative 999 convention for missing data is used consistently throughout, which simplified our data processing code.
The process of downloading and parsing this data revealed several challenges that are worth documenting for others who might work with Seshat. The Zenodo API, which provides programmatic access to the dataset, has rate limits that can cause downloads to fail if attempted too frequently. We encountered this issue initially and solved it by downloading directly from the Seshat GitHub repository, which hosts a copy of the same data. The Excel file format, while convenient for human inspection, requires specialized libraries for programmatic access. We used the pandas library in Python, which provides excellent Excel support through the openpyxl backend. However, reading the full workbook takes several seconds due to its size and complexity, so we implemented caching to avoid repeated parsing.

Our data access layer is implemented in a Python class called SeshatDB, which provides a clean interface for querying the data. The design philosophy was to hide the complexity of the underlying data format behind a simple, intuitive Application Programming Interface (API). Users can query by polity, by variable, by time range, by region, or by any combination of these filters. The class handles the mapping from user-friendly variable names like population to the actual column names in the data like PolPop. It handles the conversion from the raw data format to pandas DataFrames that can be easily analyzed with standard Python tools. And it provides utility methods for listing available polities, variables, and regions, making it easy to explore the dataset interactively.
The query interface supports several usage patterns that we anticipated would be common in our analytical work. The simplest is to retrieve all data for a specific polity, which is useful when building case studies of individual societies. A query like db.get_polity("ItRomPr") returns all variables for the Roman Principate across all time points in the data. A slightly more complex pattern is to retrieve a specific variable across multiple polities, which is useful for comparative analysis. A query like db.query(variables=["population"], time_range=(-500, 500)) returns population estimates for all polities active between 500 BCE and 500 CE. The most flexible pattern allows filtering by region, time, and variable category simultaneously, enabling targeted extraction of specific subsets of the data for focused analysis.
One of the most important features of our query interface is its handling of time-series interpolation. The raw Seshat data provides observations at irregular intervals determined by the availability of evidence and the judgment of coders about significant transitions. For some analytical purposes, we need data at regular intervals, for example, at every century or every fifty years. The interpolate parameter in our query method generates these regular time points by assuming constant values between observations. This is a simplification, of course, since historical variables do not actually remain constant over centuries, but it provides a reasonable approximation when the underlying data is sparse. The interpolated values are flagged so that downstream analysis can distinguish them from actual coded observations.
Let us examine the data quality in detail, since this is crucial for understanding what kinds of analyses the data can and cannot support. The PropCoded column provides a straightforward metric: it indicates what percentage of variables have been coded for each observation. Across the 1,494 observations in Equinox-2020, this ranges from zero, meaning no variables were coded, to one hundred, meaning all variables were coded. The mean is approximately seventy percent, indicating that most observations have a majority of variables coded but few have complete coverage. This is not surprising given the challenges of historical evidence: even well-documented societies have gaps in the record, and many variables are simply unobservable given available sources.
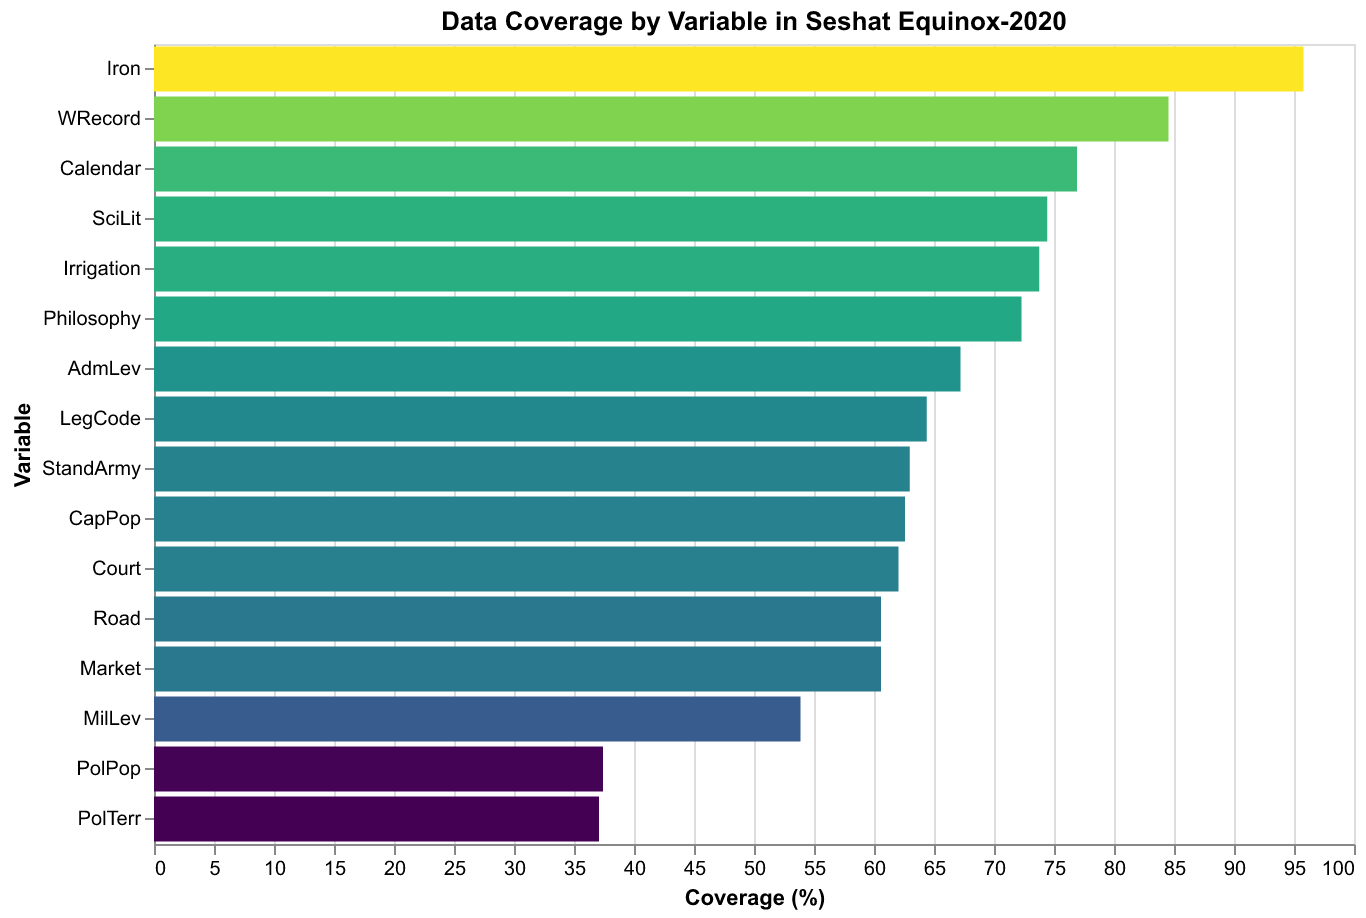
The coverage varies systematically across variables as well as across observations. Variables related to writing and formal institutions tend to have the highest coverage, in the range of eighty to ninety percent, because these features leave direct evidence in the form of texts, inscriptions, and architectural remains. Variables related to quantitative measures like population size and territorial extent tend to have lower coverage, in the range of thirty to forty percent, because these require estimation from indirect evidence and are subject to greater uncertainty. Military and economic variables fall somewhere in between, with coverage depending on the specific variable and the nature of available evidence.
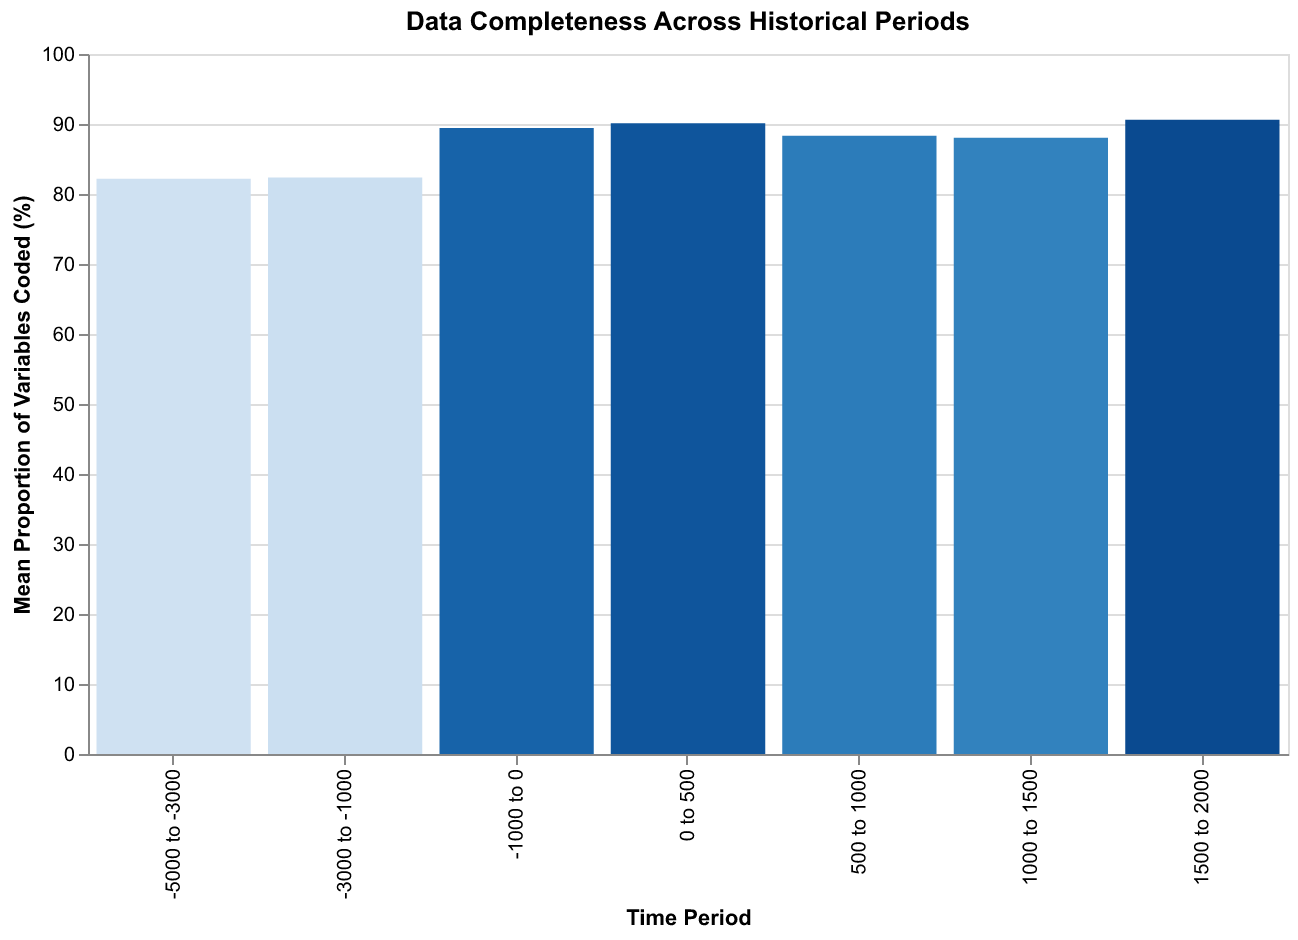
The coverage also varies systematically across time periods. Earlier periods, before the invention of writing or during phases when written evidence is sparse, have lower average coverage than later periods. The data show mean coverage of around fifty percent for observations before 1000 BCE, rising to around seventy percent for observations between 1000 BCE and 500 CE, and approximately eighty percent for observations after 500 CE. This pattern reflects the cumulative nature of historical evidence: more recent periods generally have better preservation and more abundant sources, allowing more complete coding. Analysts need to be aware of this bias when comparing results across different time periods.
Geographic coverage is similarly uneven. Southwest Asia, which includes Mesopotamia and the Fertile Crescent, has the densest coverage in the earliest periods, reflecting the early development of complex societies and writing in this region. Europe has dense coverage in the classical and medieval periods, reflecting the abundance of Greek, Roman, and medieval European sources. East Asia, particularly China, has excellent coverage throughout the historical period due to the Chinese tradition of systematic record-keeping. Other regions, including Africa, the Americas, and Oceania, have sparser coverage that reflects both the later development of complex societies in some areas and the greater challenges of evidence preservation in others.
The handling of uncertainty in Seshat deserves special attention because it represents a significant methodological innovation. Traditional databases force entries into single values, discarding information about how confident we should be in those values. Seshat preserves uncertainty through several mechanisms. First, the quality codes like inferred present or disputed indicate when a value is less certain than a simple present coding would suggest. Second, numeric variables can be expressed as ranges rather than point estimates, with both minimum and maximum values stored. Third, the codebook instructions encourage coders to record unknown rather than guessing when evidence is insufficient. Together, these mechanisms preserve valuable information that would otherwise be lost and allow analysts to incorporate uncertainty into their models.
Our parsing code extracts these uncertainty indicators and makes them available for downstream analysis. The ParsedValue data class that we defined includes fields for the raw value, the parsed numeric value if applicable, minimum and maximum values for ranges, quality indicators, and flags for whether the value was inferred or disputed. When we load data through SeshatDB, we can choose whether to access the point estimates, which are appropriate for exploratory analysis, or the full uncertainty information, which is appropriate for more rigorous statistical modeling. The point estimates for ranges are computed as midpoints, a reasonable default that can be adjusted if analysis requires a different approach.
To illustrate what the data reveals, let us examine a specific case study: the evolution of administrative complexity in the Roman world. We can query the database for all polities in the Latium NGA, which covers the heartland of Roman civilization, and extract the AdmLev variable that measures the number of levels in the administrative hierarchy. The resulting time series shows a clear pattern of increasing complexity over centuries, from the relatively simple structures of the early Latin communities through the elaborate bureaucracy of the Roman Empire. The number of administrative levels rises from two or three in the archaic period to five or six during the Principate, before declining again in the late Roman and post-Roman periods.
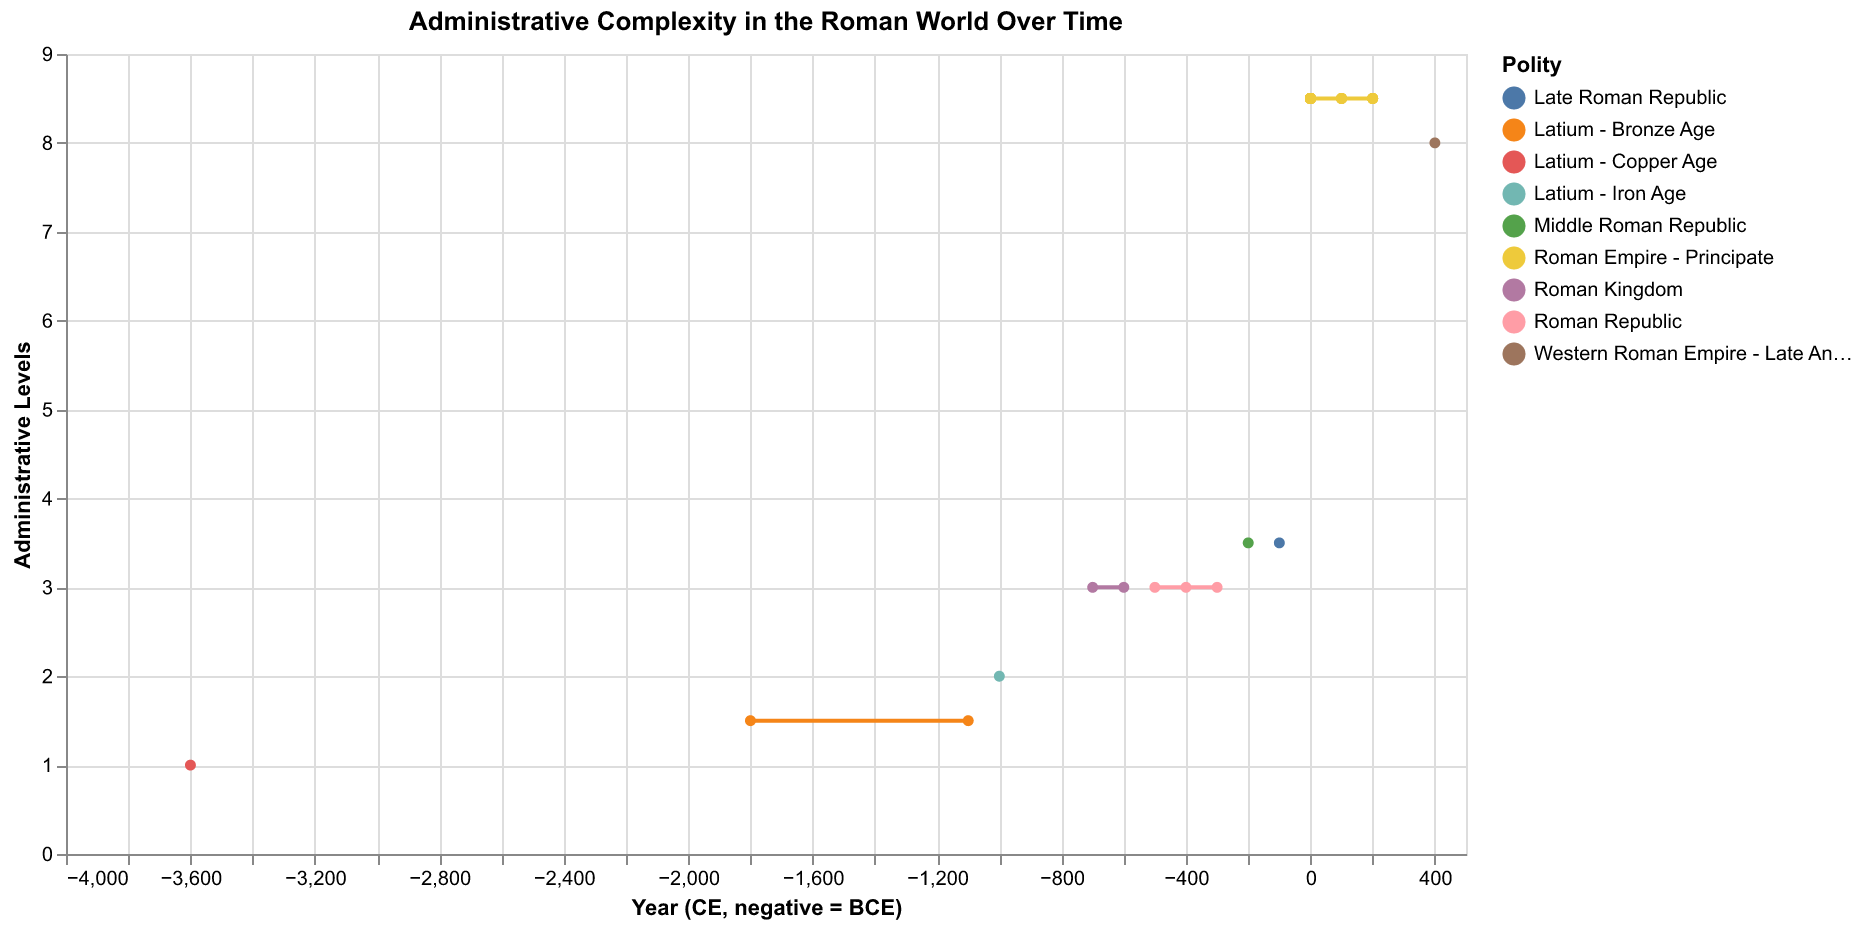
This pattern is precisely what theories of state formation would predict. As polities grow in population and territory, they face coordination challenges that require more elaborate administrative structures. A small city-state can be governed by a single ruler with a handful of advisors, but an empire spanning continents requires regional governors, provincial administrators, local officials, and specialized bureaucracies for taxation, law enforcement, and public works. The Roman case illustrates this dynamic clearly, with the complexity of administration tracking the expansion and contraction of political scale. When we replicate this analysis for other regions in Seshat, we find similar patterns, suggesting that this is a general dynamic of state formation rather than something specific to Roman history.
Another revealing pattern emerges from examining the correlation between different complexity variables. Societies with high administrative complexity also tend to have high levels of urbanization, measured by the population of the largest settlement. They tend to have elaborate writing systems and record-keeping practices. They tend to have professional militaries and formalized legal codes. These correlations are not perfect, individual societies deviate in various ways, but the overall pattern is strong and consistent across regions. This suggests that social complexity is not a single-dimensional phenomenon but a coherent package of institutional features that tend to develop together.
The interpretation of these patterns requires caution, however. Correlation does not imply causation, and the patterns we observe in historical data could reflect several different causal mechanisms. Perhaps administrative complexity causes urbanization by creating the coordination capacity needed to support large populations in dense settlements. Or perhaps urbanization causes administrative complexity by creating coordination problems that demand bureaucratic solutions. Or perhaps both are driven by some third factor, such as agricultural productivity or geographic advantages for trade, that creates the resource base for both institutional elaboration and population concentration. Distinguishing among these possibilities requires more than observational data; it requires models that specify causal mechanisms and generate testable predictions about how variables should co-evolve over time.
This is where the integration of Seshat data with cliodynamic models becomes crucial. The data alone tells us what happened: which societies had which features at which times, how those features changed over centuries, and how they correlated with one another. But the data cannot tell us why these patterns emerged or whether they will continue into the future. For that, we need theoretical models that propose mechanisms linking the variables and generate predictions that can be tested against the data. Structural-Demographic Theory, which we explored in our introductory essay, provides exactly this kind of theoretical framework. It proposes that population growth, elite competition, and state fiscal health are causally linked in feedback loops that generate predictable dynamics of expansion and contraction, what Turchin calls secular cycles.
Testing Structural-Demographic Theory against Seshat data requires mapping the theory's variables onto the database's variables. The theory's core variables are population, elite population, wages or popular well-being, and state fiscal health. Seshat provides direct measures of population through the PolPop variable, though as we noted, this variable has relatively low coverage due to the difficulty of estimating ancient populations. For elite variables, we can use proxies like the number of administrative levels, which reflects the size of the bureaucratic elite, or the presence of professional soldiers and officers, which reflects the military elite. For well-being, we can use indicators of economic development like markets, roads, and irrigation systems. For state fiscal health, we can use indicators of state capacity like the presence of formal legal codes, courts, and examination systems for selecting officials.
These mappings are necessarily imperfect. The theory's variables are idealized abstractions that may not correspond perfectly to any single variable in the historical record. Population, for instance, is a straightforward concept, but measuring it in pre-modern societies is fraught with difficulty. Censuses were rare before the modern era, and those that existed often undercounted significant portions of the population. Archaeological estimates based on settlement density and carrying capacity involve substantial assumptions that may not hold in all cases. The Seshat coding aggregates these various estimation methods into single values, but the underlying uncertainty remains. Our analytical approach must account for this by treating population estimates as rough indicators rather than precise measurements and by testing whether our conclusions are robust to plausible variations in the estimates.
The challenges are even greater for variables like elite population and wages, which the theory treats as crucial drivers of instability but which are difficult to measure directly in most historical societies. We have no payroll records for ancient Rome that would tell us how many people sought elite positions or how wages changed over time. We must instead rely on proxies, indirect indicators that we believe are correlated with the underlying variables of interest. The number of administrative levels is a proxy for bureaucratic elite size because more levels presumably require more officials to staff them. The prevalence of slavery might be a proxy for popular immiseration because heavy reliance on slave labor often indicates that free labor is cheap. The construction of monumental architecture might be a proxy for state fiscal health because such projects require substantial resources. These proxies are reasonable but imperfect, and our analyses must acknowledge the gap between what we can measure and what the theory is really about.
The process of building our data access infrastructure illustrates the iterative nature of software development in a research context. Our initial implementation of SeshatDB assumed that the Excel file would have a specific structure with columns in specific positions. When we encountered actual data, we discovered that this assumption was wrong: the column names and positions differed from what we expected, and some columns had different encodings than we anticipated. We revised our code to be more flexible, using column names rather than positions to identify data and handling multiple possible encodings for missing values. This kind of iteration, writing code based on assumptions, testing against real data, and revising when assumptions prove wrong, is characteristic of data-intensive research where the structure of the data cannot be fully anticipated in advance.
Another challenge we encountered was handling the Excel workbook's multiple sheets. Our initial code assumed a single data sheet, but the actual workbook has more than a dozen sheets containing different views of the data, supplementary information, and documentation. We needed to identify which sheet contained the primary time-series data, the TSDat123 sheet, and write code to specifically extract that sheet. We also needed to integrate information from supplementary sheets, particularly the Polities sheet that contains metadata like world region and complexity level that is not included in the main data sheet. This required joining tables on common keys, the polity identifier PolID, a standard database operation but one that requires careful attention to ensure that the join does not introduce errors or lose data.
The variable naming conventions in Seshat also required adaptation. The raw column names in the Excel file are abbreviated codes that are not immediately interpretable: PolPop for polity population, AdmLev for administrative levels, WRecord for written records. We built a mapping layer that translates user-friendly names like population and hierarchy into the actual column names, making the query interface more intuitive. We also organized variables into categories that match the theoretical structure of cliodynamic analysis, with separate categories for social complexity, military, economic, political, and religious variables. This organization makes it easier to query all variables of a particular type, which is useful when exploring how different aspects of social organization correlate with one another.
Let us walk through a concrete example of how to use our query interface. Suppose we want to compare population estimates across all polities in the European world region during the medieval period, from 500 CE to 1500 CE. We would write a query like db.query(variables=["population"], time_range=(500, 1500), regions=["Europe"]). But wait, the regions filter in our interface expects NGA names like Latium or Paris Basin, not world region names like Europe. We need to first look up which NGAs belong to Europe, then pass those to the query. Alternatively, we could modify our query interface to support filtering by world region directly, which would require joining the main data with the Polities metadata sheet. We implemented this functionality in a later version of the code, but it illustrates how the needs of analysis drive iterative development of the data access layer.
The experience of working with Seshat has deepened our appreciation for the challenges of large-scale historical data projects. Every design decision involves trade-offs. Coding more variables provides more information but requires more expert time and introduces more opportunities for error. Coding at finer temporal resolution captures more historical detail but multiplies the number of observations that must be coded and increases the risk of apparent trends that are really just noise. Including more societies provides broader coverage but may stretch expert knowledge thin, with coders working outside their areas of specialization. The Seshat team has made thoughtful decisions at each of these choice points, but no set of decisions is perfect, and users of the data need to understand the trade-offs that shaped the dataset they are working with.
The documentation that accompanies Seshat is essential for this understanding. The codebook, which runs to hundreds of pages, specifies exactly how each variable should be coded, with definitions, examples, and guidance for edge cases. The published papers describing the project explain the rationale for design decisions, the process by which experts were recruited and coordinated, and the methods used to ensure consistency across coders. The data releases include detailed metadata about version histories, known issues, and planned updates. Responsible use of Seshat requires engaging with this documentation, not just downloading the numbers and running analyses. We spent considerable time reading the codebook and related papers before attempting any serious analysis, and this investment has paid off in better understanding of what the data can and cannot tell us.
The collaborative nature of Seshat also introduces distinctive dynamics into the research process. Unlike datasets collected by a single research team with a unified vision, Seshat aggregates contributions from many experts with different backgrounds, theoretical orientations, and methodological preferences. This diversity is a strength because it brings multiple perspectives to bear on complex questions and reduces the risk of systematic biases that might affect a more homogeneous team. But it is also a challenge because it requires coordination mechanisms to ensure consistency and resolve disagreements. The Seshat governance structure includes editorial boards, data councils, and review processes that manage this complexity, but the underlying tension between diversity and consistency remains.
Our replication project adds another layer to this collaborative structure. We are not contributing new data to Seshat but rather consuming the data that others have created and using it to test theories that others have developed. This positions us as secondary analysts, building on the work of primary data collectors and theorists. Secondary analysis is a legitimate and important part of science, especially when it involves replication, the attempt to reproduce results using the same data and methods to verify that they are robust. But secondary analysts face distinctive challenges. We did not make the coding decisions that shaped the data, and we may not fully understand the considerations that went into those decisions. We are dependent on documentation that may be incomplete or ambiguous. We lack the tacit knowledge that primary data collectors accumulate through years of working with their data.
These challenges have shaped our approach to analysis. We prioritize transparency, documenting our analytical choices and making our code publicly available so that others can verify and extend our work. We prioritize robustness, testing whether our conclusions hold up under alternative analytical choices and flagging when they depend on specific assumptions. We prioritize humility, acknowledging uncertainty and avoiding overclaiming about what the data can tell us. These principles apply to any empirical research, but they are especially important when working with complex historical data where many things could go wrong and where the stakes, understanding the dynamics of human societies, are high.
The computational infrastructure we have built around Seshat reflects these principles. The SeshatDB class provides a clean interface that abstracts away the messy details of the raw data format, but it also preserves access to those details for users who want to verify that the abstraction is not hiding something important. The parser preserves uncertainty indicators rather than collapsing everything to point estimates. The query interface supports filtering on the quality of data, allowing analysts to focus on higher-certainty observations when that is appropriate. The code is organized into modules with clear responsibilities, making it easier to locate and fix bugs when they are discovered. All of this represents significant investment beyond what would be needed for a simple one-off analysis, but we believe the investment is worthwhile because it creates infrastructure that can support ongoing research.
Looking forward, we see several directions for extending our data infrastructure. First, we plan to integrate additional data releases from Seshat as they become available. The Polaris-2025 release expands coverage to additional societies and time periods, and incorporating this data will strengthen the tests we can conduct. Second, we plan to implement more sophisticated handling of uncertainty, including probabilistic methods that propagate uncertainty through calculations rather than just flagging it. Third, we plan to build validation tools that check for common data quality issues like impossible values, inconsistent temporal sequences, and outliers that might indicate coding errors. Fourth, we plan to create visualization tools that make it easier to explore the data interactively, building on the charts we have created for this essay.
The visualizations in this essay illustrate some of what we can learn from Seshat with relatively simple tools. The timeline chart shows the temporal span of polities across different regions, revealing patterns of political succession and the uneven coverage of the database. The coverage chart shows how data completeness varies across variables, highlighting which aspects of historical societies are best documented and which remain obscure. The geographic chart shows the distribution of polities across world regions, revealing both the genuine historical concentration of complex societies in certain areas and the biases introduced by scholarly attention and evidence preservation. The Rome complexity chart shows how a specific variable evolves over time in a specific region, illustrating the kinds of trajectories that cliodynamic theories seek to explain. These are exploratory visualizations, designed to reveal patterns and generate questions rather than to test specific hypotheses, but they demonstrate the analytical potential of the data.
The limitations of Seshat constrain what kinds of questions we can address. The most fundamental limitation is coverage: despite its ambitious scope, Seshat covers only a fraction of the societies that have existed in human history, and the coverage is biased toward certain regions, time periods, and types of societies. We cannot use Seshat to study hunter-gatherer bands, which are essentially absent from the database, or to study the vast majority of agricultural villages that never developed into states. We cannot use Seshat to study recent history, which lies outside its temporal scope, or to study the details of individual events, which it does not capture. We can use Seshat to study patterns across complex pre-modern societies, a valuable but limited domain.
Another limitation is temporal resolution. Seshat provides observations at roughly century intervals, which is appropriate for studying long-run trends but too coarse for studying short-run dynamics. Secular cycles, which are the main focus of Structural-Demographic Theory, unfold over two to three centuries, so century-resolution data should in principle be adequate for detecting them. But the theory also predicts that the transition from integrative to disintegrative phases can be rapid, occurring over decades rather than centuries. This rapid transition would be difficult to observe in data with century resolution, which might show only a sudden jump from stable to unstable without capturing the dynamics of the transition itself. Finer-resolution data, where it exists, would be valuable for studying these transitional dynamics.
The proxy problem, which we discussed earlier, represents another significant limitation. Many of the variables that matter most for cliodynamic theory, like elite frustration, popular well-being, and state legitimacy, are not directly observable and must be inferred from proxies. The mapping from theory to data is therefore uncertain, and different researchers might choose different proxies that lead to different conclusions. We have tried to be transparent about our proxy choices and to test whether conclusions are robust to alternative choices, but the fundamental problem remains. Progress will require both better theories that generate predictions about observable variables and better measurement strategies that capture unobservable variables through carefully validated instruments.
Despite these limitations, Seshat represents a remarkable achievement and a valuable resource for testing theories of historical dynamics. The alternative to working with imperfect data is working with no data at all, relying on impressionistic judgments about historical patterns that are subject to all the biases of human cognition. Systematic data, even data with gaps and uncertainties, provides a disciplining function that forces theorists to be explicit about their claims and provides a basis for adjudicating between competing theories. The Seshat team has done the hard work of encoding thousands of historical judgments in a structured format that researchers around the world can access and analyze. Our job, as secondary analysts, is to use this resource responsibly and to contribute to the cumulative scientific enterprise of understanding human history.
The broader significance of Seshat extends beyond its immediate utility for testing cliodynamic theories. By demonstrating that systematic historical databases are possible and valuable, the project has helped to legitimize quantitative approaches to history within a discipline that has traditionally been skeptical of such methods. The project has also created a template that other researchers can follow, showing how to organize large-scale collaborative data collection, how to handle uncertainty and disagreement among experts, and how to make data available in formats that support diverse analytical uses. Future projects will be able to build on Seshat's infrastructure and lessons learned rather than starting from scratch.
The process of building our data access layer also illustrates broader themes about how research is conducted in the age of artificial intelligence and computational tools. We used Claude Code, an AI development environment, to write the code that downloads, parses, and queries Seshat data. The AI was able to generate working code quickly, handle edge cases that would have taken hours to debug manually, and produce documentation that makes the code accessible to other users. But the AI needed human guidance to understand what we were trying to accomplish, why certain design choices were preferable to alternatives, and how the data fits into the larger context of cliodynamic research. The collaboration was more productive than either human or AI working alone, suggesting that this kind of human-AI partnership will become increasingly important as research tools become more sophisticated.
The question of how cliodynamic theories might apply to contemporary societies often arises when discussing the Seshat project, and it is worth addressing directly even though it lies somewhat outside our immediate research focus. Seshat covers pre-modern societies, ending around 1900 CE, which means it cannot directly address questions about modern industrial democracies. However, the patterns identified in historical data may have relevance for understanding contemporary dynamics if the underlying mechanisms remain operative. Structural-Demographic Theory was developed partly through historical analysis but has been applied to modern societies, most notably in Turchin's analyses of the United States. The question is whether the same feedback loops that drove secular cycles in agricultural empires continue to operate in post-industrial knowledge economies, or whether technological and institutional changes have fundamentally altered the dynamics. This question cannot be answered using Seshat data alone, but Seshat provides the historical baseline against which contemporary patterns can be compared.
The availability of Seshat data has stimulated a growing body of research that uses the database to address diverse questions about human history. Researchers have used Seshat to study the evolution of political complexity, finding that increases in administrative hierarchy follow predictable patterns related to population size and territorial extent. They have used it to study the spread of moralizing religion, finding that moralizing high gods tend to appear in societies facing specific coordination challenges. They have used it to study the determinants of warfare, finding that the frequency and severity of conflict vary systematically with political and economic conditions. They have used it to study the emergence of inclusive institutions, finding that constraints on rulers tend to appear under specific conditions related to military technology and economic organization. This body of research demonstrates the fertility of the Seshat approach for generating and testing hypotheses about historical dynamics.
The criticisms that have been directed at Seshat and similar projects deserve acknowledgment and engagement. Some historians argue that reducing complex historical realities to quantitative codes necessarily distorts those realities, stripping away the context and nuance that give historical phenomena their meaning. This criticism has merit, and we have tried to address it by emphasizing that quantitative analysis complements rather than replaces qualitative understanding. The codes in Seshat are based on detailed qualitative knowledge accumulated by expert coders, and interpreting the quantitative patterns requires returning to that qualitative knowledge. The database is not meant to replace historical scholarship but to provide a tool for testing hypotheses generated through that scholarship.
Other critics argue that the variables in Seshat reflect particular theoretical perspectives that may bias the findings. The emphasis on social complexity, for instance, reflects an evolutionary perspective that some scholars reject. The operationalization of specific variables may embed assumptions that are not universally shared. This criticism is harder to address because all research embeds theoretical assumptions, and there is no view from nowhere that could provide a perfectly neutral foundation. The best response is transparency: making the assumptions explicit, testing robustness to alternative operationalizations, and inviting critical engagement from researchers with different perspectives. The Seshat project has generally embraced this approach, publishing detailed codebooks and engaging with critical responses.
In conclusion, the Seshat Global History Databank represents a landmark achievement in the quantification of historical knowledge. By encoding systematic information about hundreds of societies across thousands of years, it provides a foundation for testing theories about how societies function and change. Our cliodynamics replication project has built on this foundation, creating data access infrastructure that makes Seshat accessible for our analytical purposes and producing visualizations that reveal patterns in the data. The journey has revealed both the promise and the challenges of working with large-scale historical data: the promise of subjecting historical theories to rigorous empirical tests, and the challenges of missing data, uncertain values, imperfect proxies, and biased coverage. We proceed with eyes open to these challenges, committed to transparent methods and humble conclusions, and eager to see what the data will reveal as our analysis continues.
The one hundred sixty-eight variables in the Equinox-2020 dataset deserve more detailed examination because they reveal the theoretical priorities that shaped the data collection effort. The largest category consists of variables measuring social complexity, the multi-dimensional phenomenon that includes administrative elaboration, settlement hierarchy, writing and record-keeping, and economic specialization. The PolPop variable measures total polity population, a fundamental indicator of social scale that drives many other aspects of organization. The PolTerr variable measures territorial extent in square kilometers, capturing the spatial reach of political control. The CapPop variable measures the population of the largest settlement, typically the capital, which indicates the degree of urbanization and the capacity for administrative concentration. These three variables together capture what we might call the scale of the polity, how many people it governs, how much territory it controls, and how concentrated its population is in central places.
Administrative hierarchy is measured through several variables that capture different aspects of bureaucratic organization. The AdmLev variable counts the number of distinct levels in the administrative hierarchy, from the paramount ruler at the top to the lowest level of local officials who interact directly with the governed population. A simple chiefdom might have only two levels, a chief and village headmen, while a complex empire might have six or more levels, including provincial governors, regional administrators, district officials, and local magistrates, each reporting to the level above. The MilLev variable similarly counts levels in the military hierarchy, capturing the organizational depth of armed forces. The ReligLev variable counts levels in the religious hierarchy, relevant for societies where religious institutions have significant administrative functions separate from secular government.
The presence or absence of specific institutional features is captured through binary variables that form a checklist of complexity indicators. The ProfOfficer variable indicates whether the society had professional military officers, distinct from warriors who fight as needed. The ProfSoldier variable indicates whether the society had full-time professional soldiers, as opposed to militias or levies raised in wartime. The ProfPriest variable indicates whether the society had specialized religious practitioners who devoted their lives to religious duties. The FullTBur variable indicates whether the society had full-time bureaucrats, administrators whose occupation was governance rather than something else they did in addition to other activities. Each of these represents a threshold in organizational development, the emergence of specialized roles that require training, career paths, and institutional support.
Information technology receives considerable attention in the Seshat variable set, reflecting the theoretical importance of writing and record-keeping for social complexity. The Mnemonic variable indicates whether the society used mnemonic devices like quipus or notched sticks to record information, a precursor to full writing systems. The NonWRecord variable indicates non-written record-keeping such as pictorial representations or tally systems. The WRecord variable indicates the presence of written records in any form. The Script variable distinguishes between different types of writing systems, from logographic scripts where symbols represent words to alphabetic scripts where symbols represent sounds. The NonPhWrit and PhAlph variables specifically identify non-phonetic writing and phonetic alphabets respectively. This granular coding allows researchers to track the evolution of information technology and its relationship to other aspects of complexity.
The content of written records, where they exist, is captured through additional variables. The Lists variable indicates whether the society produced lists as a genre of writing, important for administrative purposes like tax rolls and inventories. The Calendar variable indicates the presence of a formal calendar system for tracking time. The SacrTxt variable indicates sacred texts, written religious materials that codify doctrine and practice. The ReligLit variable indicates religious literature beyond basic sacred texts. The PractLit variable indicates practical literature like technical manuals or agricultural guides. The History variable indicates historical writing that preserves accounts of past events. The Philosophy variable indicates philosophical texts that engage in abstract reasoning. The SciLit variable indicates scientific literature that systematically investigates natural phenomena. The Fiction variable indicates fictional literature created for entertainment or edification. This comprehensive treatment of written genres allows researchers to study the differentiation of intellectual production as societies become more complex.
Economic variables capture the material basis of social organization. The Article variable indicates the use of articles of exchange that serve monetary functions even if not formal currency. The Token variable indicates the use of tokens or counters for economic transactions. The PrecMetal variable indicates the use of precious metals as stores of value. The ForCoin variable indicates the presence of foreign coinage circulating in the society. The IndigCoin variable indicates locally minted coinage. The PaperCurr variable indicates paper currency or its equivalent. Together these variables trace the evolution of money and its role in facilitating economic exchange. Other economic variables capture infrastructure: the Irrigation variable indicates irrigation systems for agriculture, the WaterSuppl variable indicates public water supply systems, the Market variable indicates formal marketplaces, the FoodStor variable indicates large-scale food storage facilities, and the Road, Bridge, Canal, and Port variables capture transportation infrastructure.
Military technology variables form another substantial category, tracking the development of weapons, armor, and fortifications across societies. Projectile weapons are captured through variables for Javelin, Atlatl, Sling, SelfBow, CompBow, Crossbow, and various siege weapons. Hand weapons include WarClub, BattleAxe, Dagger, Sword, Spear, and Polearm. Armor types include WoodArmor, LeathArmor, Shield, Helmet, Breastplate, LimbProt, Chainmail, ScaleArmor, LaminArmor, and PlateArmor. Metal working is tracked through Copper, Bronze, Iron, and Steel variables. Fortification types include DefPosition, Palisade, Rampart, Ditch, Moat, NonMStone, StoneWall, FortCamp, ComplxFort, LongWall, and ModernFort. This detailed treatment allows researchers to study military innovation and its relationship to political organization, a key theme in theories of state formation.
Conflict itself is measured through variables that distinguish different types of violence. The ExternalW variable indicates warfare against external enemies. The InternalW variable indicates civil war or internal armed conflict. The IntraElitW variable indicates conflict within the ruling elite. The PopUprising variable indicates popular uprisings against the ruling order. The MilRevolt variable indicates military mutinies or coups. The SepRebellion variable indicates separatist rebellions seeking independence for a region. These distinctions are theoretically important because different types of conflict may have different causes and different consequences for social development. Structural-Demographic Theory, for instance, predicts that elite competition and popular immiseration lead to different patterns of violence with different characteristics.
The severity of conflict is captured through variables describing war practices. The Annexation variable indicates whether the society typically annexed conquered territories. The Looting variable indicates whether the society typically looted conquered populations. The Sack variable indicates whether the society typically destroyed conquered cities. The Rape variable indicates whether sexual violence against enemies was common. The Enslavement variable indicates whether the society typically enslaved prisoners of war. The Imprisonment variable indicates whether captured enemies were imprisoned. The Destruction variable indicates deliberate destruction of enemy property. The Torture variable indicates use of torture against enemies. The Mutilation variable indicates mutilation of enemies. The TargMassacre variable indicates targeted killing of specific groups. The GenMassacre variable indicates general massacres of enemy populations. The Extermination variable indicates attempts to completely eliminate enemy groups. The Ethnocide variable indicates attempts to destroy enemy cultures without necessarily killing everyone. This grim catalog of violence allows researchers to study how the severity of warfare varies across societies and time periods, a topic of considerable interest for understanding the civilizing process that Norbert Elias described.
Religion and ideology are captured through variables measuring supernatural beliefs and their social functions. The HeredStatus variable indicates whether status was hereditary rather than achieved. The FormalHStatus variable indicates formal recognition of hereditary status differences. The SelectStatus variable indicates systems for selecting rulers or elites based on criteria. The IdEqual variable indicates ideologies of equality among members of the society. The IdElitCom variable indicates ideologies justifying elite privileges. The IdRuleCom variable indicates ideologies legitimating ruler authority. The IdProsocial variable indicates ideologies promoting prosocial behavior toward the community. The PublGoods variable indicates collective provision of public goods. The RuleLegGods variable indicates that rulers claimed legitimacy from gods. The RuleGods variable indicates that rulers claimed to be divine. The ConstrGov and ConstrNonGov variables indicate constraints on government power from within government or from outside groups.
Moralizing supernatural beliefs receive particular attention because they are theoretically important for explaining the emergence of large-scale cooperation. The PrimaryMSP variable indicates whether there was a primary moralizing supernatural power like a high god or cosmic law. The CertainMSP variable indicates whether punishment from supernatural sources was certain. The BroadMSP variable indicates whether supernatural concern extended to a broad range of behaviors. The TargetedMSP variable indicates whether supernatural punishment targeted specific transgressions. The RulerMSP variable indicates whether rulers were subject to supernatural judgment. The ElitesMSP variable indicates whether elites were subject to supernatural judgment. The CommonersMSP variable indicates whether commoners were subject to supernatural judgment. The AfterlifeMSP variable indicates whether supernatural punishment occurred in an afterlife. The ThislifeMSP variable indicates whether supernatural punishment occurred in this life. The AgencyMSP variable indicates whether supernatural agents actively punished wrongdoing. This detailed treatment reflects the influential theory that moralizing high gods helped solve cooperation problems in large societies by providing supernatural enforcement of social norms.
Having described the variables in detail, let us turn to a more systematic examination of patterns in the data. One of the most striking findings from analyzing Seshat is the strong correlation among complexity variables across different domains. Societies with complex administrative hierarchies also tend to have elaborate writing systems, professional militaries, developed infrastructure, and sophisticated religious institutions. This pattern is consistent with the theoretical expectation that different aspects of complexity co-evolve, with developments in one domain enabling or requiring developments in others. A society that develops writing, for instance, can maintain more elaborate administrative records, enabling more layers of bureaucracy and more extensive territorial control. A society that develops professional armies can project power over larger territories, generating resources that support additional institutional development. The specific causal pathways vary, but the overall pattern of correlated development is robust.
We can quantify this pattern by computing correlations among complexity variables across the polities in Seshat. The correlation between administrative levels and polity population is approximately 0.65, indicating that larger polities tend to have more bureaucratic layers. The correlation between administrative levels and writing is approximately 0.72, indicating that societies with complex administrations almost always have writing systems. The correlation between population and territory is approximately 0.58, indicating that more populous polities tend to control larger territories, though the relationship is not deterministic since some polities achieved high populations in small areas through intensive agriculture while others controlled vast but sparsely populated territories. These correlations provide quantitative support for the qualitative observation that complexity is a package deal, with different components developing together.
The temporal patterns in the data reveal the long sweep of social evolution over the past ten millennia. The earliest polities in Seshat, dating to the Neolithic period around 9600 BCE, are small-scale farming communities with minimal institutional development. They have populations in the hundreds or low thousands, control territories of a few hundred square kilometers at most, lack writing, lack professional specialists, and have minimal administrative hierarchy. As we move forward in time, we see the gradual emergence of more complex societies. By 3000 BCE, the earliest states appear in Mesopotamia and Egypt, with populations in the tens of thousands, territorial control spanning thousands of square kilometers, nascent writing systems, and administrative hierarchies with three or four levels. By 500 BCE, large empires like the Persian Achaemenid state have emerged, with populations in the millions, territories spanning hundreds of thousands of square kilometers, fully developed writing systems, professional militaries, and administrative hierarchies with six or more levels.
This trajectory is not uniform across regions or time periods. Different parts of the world developed complex societies at different times and through different pathways. Southwest Asia led the way, with the earliest states emerging in Mesopotamia and Egypt around 3000 BCE. Other regions followed over the subsequent millennia: China around 1500 BCE, the Mediterranean around 1000 BCE, South Asia around 500 BCE, Mesoamerica around 200 BCE, the Andes around 200 CE, and sub-Saharan Africa around 800 CE. These dates are approximate and contestable, depending on how one defines a state and interprets the archaeological evidence, but the general pattern of staggered emergence is clear. The Seshat data allows us to track these regional trajectories and compare them, asking whether the same variables predict complexity in different regions or whether different pathways led to similar outcomes.
The pathway question is particularly interesting for testing theories of state formation. Some theories emphasize warfare as the primary driver of state formation, arguing that military competition selected for larger, more organized polities that could mobilize resources for defense and conquest. Other theories emphasize economic factors, arguing that trade, irrigation, or other productive activities generated surpluses that supported administrative elaboration. Still other theories emphasize religion and ideology, arguing that shared beliefs created the social cohesion necessary for large-scale cooperation. The Seshat data provides evidence relevant to all of these theories. The strong correlation between military variables and complexity indicators supports the warfare hypothesis. The strong correlation between economic infrastructure and complexity supports the economic hypothesis. The strong correlation between moralizing religion and complexity supports the ideological hypothesis. Distinguishing among these theories requires more sophisticated analytical techniques than simple correlations, but the data provides a foundation for such analysis.
The relationship between religion and complexity deserves particular attention because it has been the subject of recent controversy. Several papers using Seshat data have addressed the question of whether moralizing high gods preceded or followed the emergence of complex societies. The question matters for understanding the causal role of religion in social evolution. If moralizing gods preceded complexity, this suggests that religion provided the ideological infrastructure for large-scale cooperation, solving the collective action problems that limit the scale of human organization. If moralizing gods followed complexity, this suggests that religion is more a consequence of than a cause of social development, perhaps serving to legitimate existing social arrangements rather than enabling new ones. The empirical evidence from Seshat has been interpreted both ways, with different analytical choices leading to different conclusions. This controversy illustrates both the promise and the challenges of using historical databases for causal inference. The data can constrain our theories, but it cannot definitively resolve questions where the evidence is ambiguous and the analytical choices are contested.
Our experience implementing the data access layer revealed numerous practical challenges that may be useful for others working with similar datasets. The Excel format that Seshat uses is convenient for human inspection but creates complications for programmatic access. Excel workbooks can contain multiple sheets, each with its own structure and purpose. The sheets can reference each other through formulas that may not be preserved when the data is extracted. Cell formatting can encode information that is lost in the extracted text. Some cells contain multiple values or structured text that requires parsing. We addressed these challenges by developing a parser that handles the specific structure of the Seshat workbook, extracting the relevant sheets, joining them on common keys, and parsing the various value formats into a consistent internal representation.
The handling of missing data was particularly important. Historical datasets inevitably have gaps where information is unavailable, and the way these gaps are coded and handled can significantly affect analytical results. Seshat uses the special value negative 999 to indicate missing data for numeric variables and various text codes like unknown and uncoded for categorical variables. Our parser recognizes these codes and converts them to a consistent internal representation that downstream analysis can filter appropriately. We implemented several modes for handling missing data: complete case analysis that excludes any observation with missing values on variables of interest, available case analysis that uses all available data for each specific analysis, and imputation approaches that estimate missing values based on patterns in the observed data. Each approach has advantages and disadvantages, and the choice among them should be guided by the specific analytical question and the patterns of missingness in the data.
The temporal structure of the data required careful handling. Seshat provides observations at irregular intervals determined by the availability of evidence and the judgment of coders about significant transitions in each polity's history. This irregular sampling creates challenges for time-series analysis, which often assumes regular intervals between observations. We implemented interpolation functionality that generates observations at regular intervals by carrying forward the most recent observed value or by linear interpolation between observed values. We also implemented functionality for aligning observations across different polities to enable comparative analysis of synchronous developments. These temporal transformations involve assumptions that may not hold in all cases, and we documented the assumptions clearly so that analysts can evaluate whether they are appropriate for their specific purposes.
The geographic structure of the data also required attention. Seshat organizes data by Natural Geographic Areas rather than by modern political boundaries, which is appropriate for historical analysis but unfamiliar to many users who are accustomed to thinking in terms of countries or continents. We implemented mapping between NGAs and higher-level geographic units like world regions, enabling queries that aggregate data across multiple NGAs. We also implemented geographic filtering that allows analysts to focus on specific regions of interest. The geographic dimension is important for testing theories about diffusion, whether innovations spread from region to region, and about environmental determinism, whether geographic factors like climate or terrain constrain social development.
The validation of our data access layer involved multiple checks to ensure that the extracted data matched the source accurately. We compared summary statistics computed from our extracted data to statistics reported in published papers that used Seshat, verifying that we obtained the same counts, means, and distributions. We examined specific polities in detail, comparing our extracted values to the source Excel files cell by cell. We implemented automated tests that check for impossible values, inconsistent temporal sequences, and other data quality issues. These validation efforts caught several bugs in early versions of our parser and gave us confidence that the current version is producing accurate extractions. We make our test suite available along with our code so that others can verify our implementation and extend the tests to cover additional cases.
The computational performance of our data access layer was a secondary consideration given the modest size of the Equinox-2020 dataset, but we implemented some optimizations that would be important for larger datasets. The initial loading of the Excel workbook is the slowest operation, taking several seconds, so we implemented caching that stores the parsed data in memory and reuses it for subsequent queries. We implemented lazy loading that defers parsing until the data is actually needed, reducing startup time for scripts that may not use all features. We implemented efficient filtering that operates on the raw data rather than building full data structures and then filtering, reducing memory usage. These optimizations are not critical for Equinox-2020 but would become important if we extend our infrastructure to handle larger datasets like the Polaris-2025 release or potential future releases with finer temporal resolution.
The visualization capabilities we developed alongside the data access layer serve both exploratory and communicative purposes. For exploration, we created functions that generate standard charts for examining distributions, correlations, and temporal patterns in the data. These charts use the Altair library, which provides a declarative grammar for specifying visualizations that is both expressive and easy to use. The charts are interactive by default, allowing users to zoom, pan, and hover for details, which facilitates the kind of data exploration that generates research questions. For communication, we created functions that export charts in formats suitable for publication, with attention to aesthetics, accessibility, and reproducibility. The visualizations in this essay were all generated using these tools, demonstrating their capability for producing publication-quality figures.
The goddess Seshat, for whom the database is named, was depicted in ancient Egyptian art as a woman wearing a leopard skin and a distinctive headdress that may have symbolized her role as recorder of time. She was the deity who noted the passage of years, counted the spoils of war, and recorded the reigns of pharaohs on the leaves of the sacred persea tree. The modern Seshat project continues this ancient tradition of recording and preserving knowledge, but with tools and ambitions that would have been unimaginable to those ancient scribes. Where they recorded the deeds of individual rulers, the modern project records the structures of entire societies. Where they worked with stylus and papyrus, the modern project works with databases and algorithms. Where they preserved knowledge for the glorification of kings, the modern project preserves knowledge for the advancement of science. It is a fitting tribute to the goddess whose name the project bears, and it is a resource that we are honored to use in our own small contribution to understanding the dynamics of human history. The goddess would surely approve of this modern incarnation of her ancient mission, even if the clay tablets and papyrus scrolls have been replaced by spreadsheets and databases.
The integration of Seshat data into our cliodynamics replication project represents a significant milestone in our research program. We now have access to systematic historical information that can be used to test the theories of Structural-Demographic Theory against actual evidence from the past. The data is imperfect, as all historical data must be, but it is vastly better than no data at all. It forces us to be precise about our claims, to specify which variables we are measuring and how, to acknowledge uncertainty where it exists, and to compare our predictions against actual historical outcomes. This discipline is the essence of the scientific method, and it is what distinguishes cliodynamics from the speculative philosophies of history that preceded it.
As we proceed with our replication work, we will use Seshat data in several ways. First, we will use it to calibrate the parameters of Structural-Demographic Theory models, finding values that make the models best fit the observed historical trajectories. Second, we will use it to test the predictions of those models, examining whether they correctly predict the timing and severity of instability episodes in different societies. Third, we will use it to explore variations in the models, asking whether the same parameter values work across different regions and time periods or whether we need region-specific or period-specific calibrations. Fourth, we will use it to compare Structural-Demographic Theory against alternative theories, asking which framework provides the best fit to the historical data. These applications will be the subject of future essays as we progress through our research agenda.
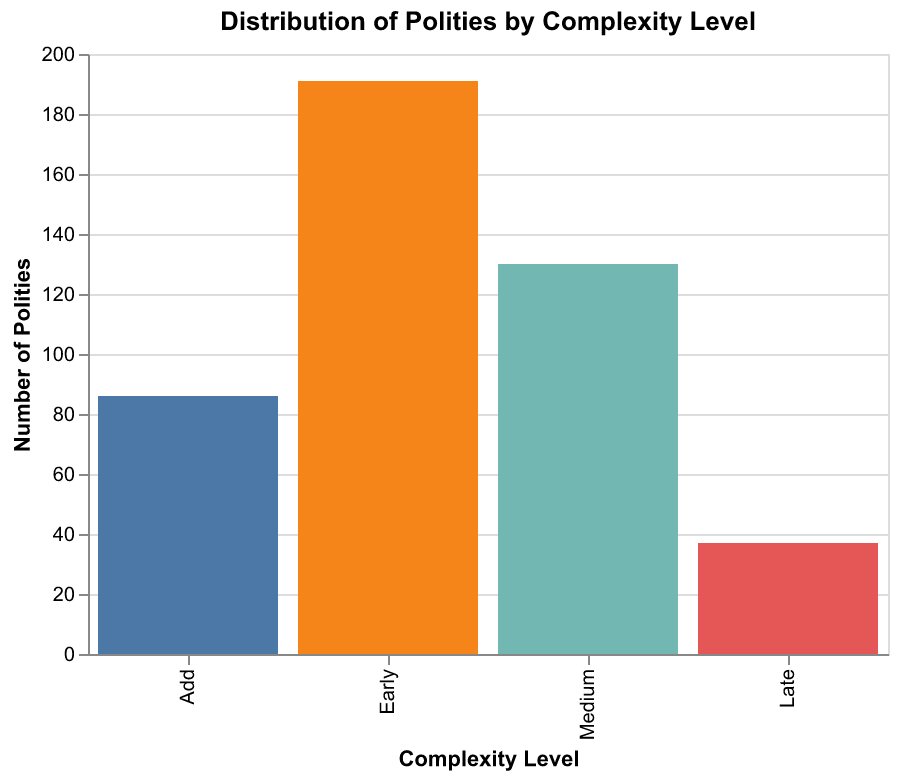
The question of how to handle different complexity levels within Seshat data illustrates the kind of analytical decision that can significantly affect results. The Seshat team classified polities into complexity categories: Add for acephalous or tribal societies, Early for simple states or chiefdoms, Medium for developed states, and Late for highly complex empires. These categories reflect overall institutional development and provide a useful organizing framework. However, analysts face choices about whether to analyze all complexity levels together, which provides more data but mixes potentially different dynamics, or to analyze them separately, which provides cleaner samples but reduces statistical power. Our approach has been to start with analyses that include all complexity levels, then test whether patterns differ across levels as a robustness check. Where patterns do differ, we investigate why, which often reveals interesting theoretical insights about how dynamics change as societies become more complex.
The sample queries we ran while developing our infrastructure revealed patterns that will guide our subsequent analysis. When we queried for all variables related to social complexity, we found that the complexity package, the bundle of features that tend to appear together in developed societies, is remarkably consistent across regions. Societies with three or more administrative levels almost always have writing, professional militaries, and formal legal systems. Societies with six or more administrative levels almost always have philosophy, science, and sophisticated financial institutions. This consistency suggests that there may be functional requirements for complex social organization, features that must be present for a society to operate at a given scale, though the specific forms these features take can vary considerably across cultures.
When we queried for temporal patterns in specific regions, we found evidence consistent with the secular cycles that Turchin's theory predicts. In the Latium NGA, for instance, the Roman trajectory shows a clear pattern: gradual increase in complexity during the Republic, peak complexity during the early Empire, gradual decline during the late Empire, and collapse in the post-Roman period. The timing of the decline phase corresponds roughly to what Structural-Demographic Theory would predict based on population pressure and elite overproduction. Similar patterns appear in other regions, though with different timing and different specific features. The Han Dynasty in China, the Abbasid Caliphate in Southwest Asia, and various European polities all show analogous rise-and-fall trajectories, suggesting that secular cycles may be a general phenomenon rather than an artifact of Roman history.
When we queried for variation in data quality across regions and time periods, we found the patterns we discussed earlier: better coverage for later periods, better coverage for regions with strong written traditions, and better coverage for variables that leave direct archaeological evidence. These patterns have implications for how we interpret our results. Conclusions drawn from well-documented periods and regions are more reliable than conclusions drawn from poorly documented ones. Cross-regional comparisons must account for differential data quality rather than treating all observations as equally informative. Our analytical framework incorporates these considerations through quality-weighted analyses that downweight observations with more missing data or lower certainty codes.
The experience of working with actual Seshat data has also revealed areas where our theoretical understanding needs refinement. For example, the theory posits that elite overproduction leads to political instability, but operationalizing elite overproduction in historical data is challenging. We can measure some proxies, like the number of administrative levels or the presence of professional classes, but these capture the size of elite institutions rather than the crucial variable of how many people aspire to elite positions relative to how many positions are available. A society might have extensive bureaucracy but also extensive mechanisms for absorbing ambitious individuals, resulting in low elite frustration despite high elite numbers. Conversely, a society might have small elite institutions but highly restrictive entry, resulting in high frustration despite low numbers. Developing better measures of elite overproduction is an important priority for future work.
Similarly, the theory posits that popular immiseration, declining well-being for ordinary people, contributes to instability by creating a pool of potential supporters for radical movements. But measuring well-being in historical societies is difficult. We can use proxies like the prevalence of slavery, the presence of widespread debt bondage, or skeletal evidence of nutritional stress, but these capture only aspects of well-being and may not be available for all societies. The Seshat data includes some variables that speak to popular conditions, but they are not the direct measures of wages or living standards that modern economic data provides. Developing creative approaches to inferring historical well-being from available evidence is another priority for future work.
The journey from raw data to tested theory is long and winding, with many opportunities for error and many challenges to overcome. The Seshat data provides the raw material, but transforming that material into scientific knowledge requires careful analysis, transparent methods, and humble acknowledgment of uncertainty. We have tried to embody these values in building our data access infrastructure, and we will continue to embody them as we move from data to models to conclusions. The stakes are high, not in the sense of personal career advancement, but in the sense that understanding historical dynamics could help humanity navigate the turbulent waters of the twenty-first century. If societies really do follow predictable patterns, and if we can identify those patterns and their drivers, then perhaps we can make better choices about how to respond to the structural pressures building in our own time. That is the promise of cliodynamics, and Seshat provides the data foundation that makes it testable.