Exploring the Future: A Guide to the Interactive Cliodynamics Explorer
Introduction: Why Interactive Exploration Matters
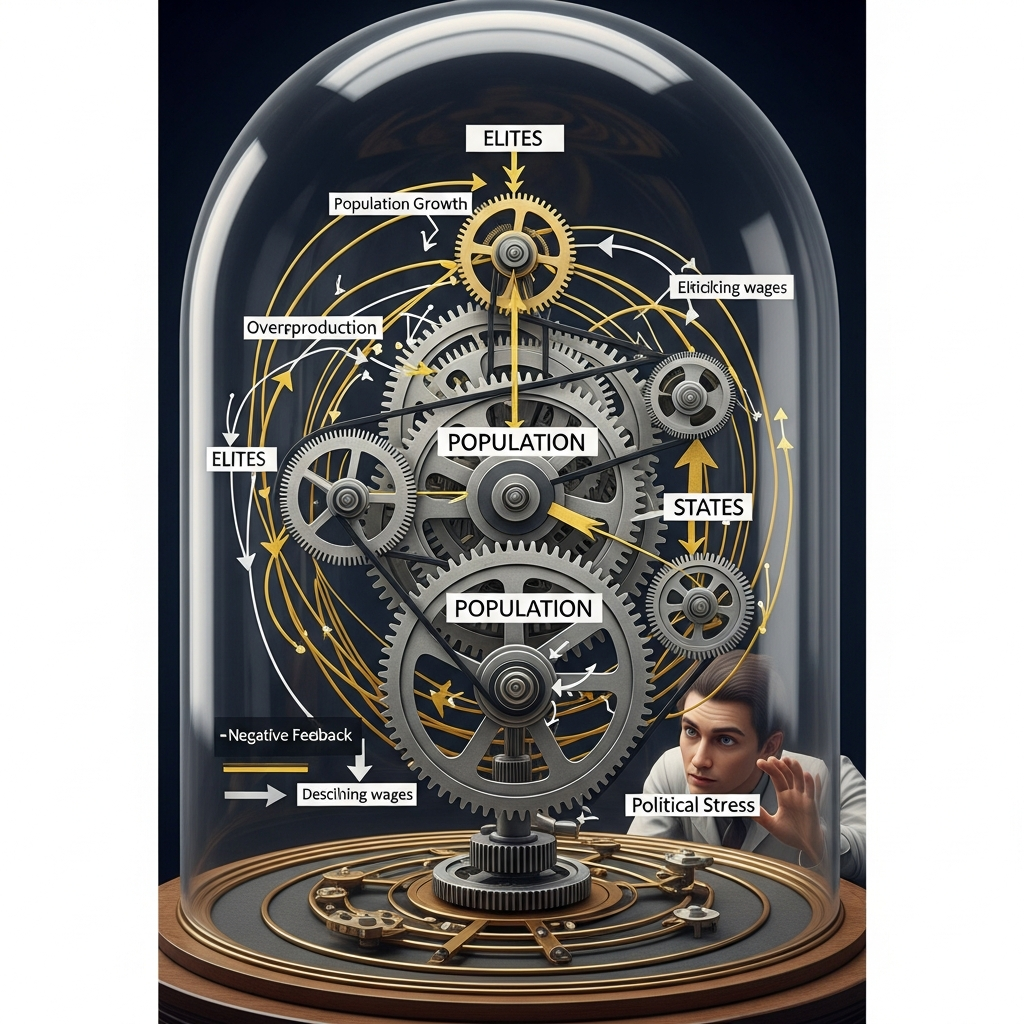
Understanding history through mathematics requires more than equations on a page. The Structural-Demographic Theory (SDT) that Peter Turchin developed describes how societies rise and fall through the interaction of population dynamics, elite competition, worker welfare, state capacity, and political stress. These five variables dance together in a complex choreography where changes to one ripple through all the others. Reading about these interactions in a textbook gives you the theory. Watching them unfold before your eyes gives you intuition.

The Cliodynamics Explorer is our answer to this challenge. It is an interactive simulation sandbox that lets you manipulate the parameters of Structural-Demographic Theory in real time and immediately see how those changes affect the trajectory of a simulated society. Want to know what happens when elite mobility increases? Move a slider and watch the Political Stress Index climb. Curious about whether a society with strong state capacity can withstand elite overproduction? Adjust the parameters and observe the outcome over two centuries of simulated time.
This essay serves as your comprehensive guide to the Explorer. We will begin with the practical mechanics of accessing and navigating the tool, then dive deep into what each parameter means and how it connects to real historical dynamics. You will learn to read the visualizations the Explorer produces, understand the historical presets we have built in, and conduct your own experiments to develop intuition about societal dynamics. By the end, you will have the knowledge to use the Explorer not just as a toy but as a genuine research tool for thinking about the forces that shape human societies.
The Explorer represents something new in how we communicate historical research. Traditional academic papers present conclusions: here is what we found, here is why we think it is true. The Explorer invites you into the process of discovery itself. You do not have to take our word for how sensitive the Political Stress Index is to elite mobility rates. You can find out for yourself, developing your own understanding through direct manipulation and observation. This is education through exploration, learning through doing.
Before we dive in, a word about what the Explorer can and cannot tell you. It implements a mathematical model, a simplified representation of reality that captures certain dynamics while necessarily omitting others. The model is based on Turchin's published work and has been calibrated to reproduce historical patterns in societies like Rome and the United States. But it remains a model. The real world has contingencies, individual decisions, natural disasters, and countless other factors that no mathematical model can capture. Use the Explorer to develop intuition about structural forces, not to make specific predictions about the future. The model tells us about tendencies and patterns, not certainties.
Getting Started: Accessing and Navigating the Explorer
The Cliodynamics Explorer lives on the web, accessible from any modern browser without installation or downloads. You can find it at the Explorer link in our site navigation, or by visiting the explorer-v2 directory directly. The tool is built with TypeScript and React, technologies chosen for their speed and responsiveness. When you adjust a parameter, you do not have to wait for a server to recalculate. The simulation runs directly in your browser, typically completing in under 100 milliseconds even for 200-year projections.
When you first load the Explorer, you will see a interface divided into two main regions. On the left is the control panel, a sidebar containing all the parameters you can adjust. On the right is the visualization area, where charts display the results of your current simulation. The interface responds to your system's color scheme preferences, displaying in light or dark mode as appropriate. Everything is designed to get out of your way and let you focus on the dynamics themselves.
The control panel is organized into logical sections. At the top you will find the Presets section, with buttons that load preconfigured parameter sets representing different historical scenarios. Below that is Initial Conditions, where you set the starting values for population, elites, wages, state health, and political stress. Further down is Model Parameters, the core rates and coefficients that determine how the system evolves. Finally, at the bottom you will find Simulation Controls for adjusting how long the simulation runs and whether it updates automatically as you change parameters.
The visualization area shows four distinct charts. The largest, spanning the full width at the top, is the Time Series chart showing all five state variables evolving over the simulation period. Below that are two Phase Space charts that plot pairs of variables against each other to reveal the trajectory through state space. At the bottom is the Political Stress Index chart, which zooms in on this crucial measure of instability and highlights when it crosses the crisis threshold.
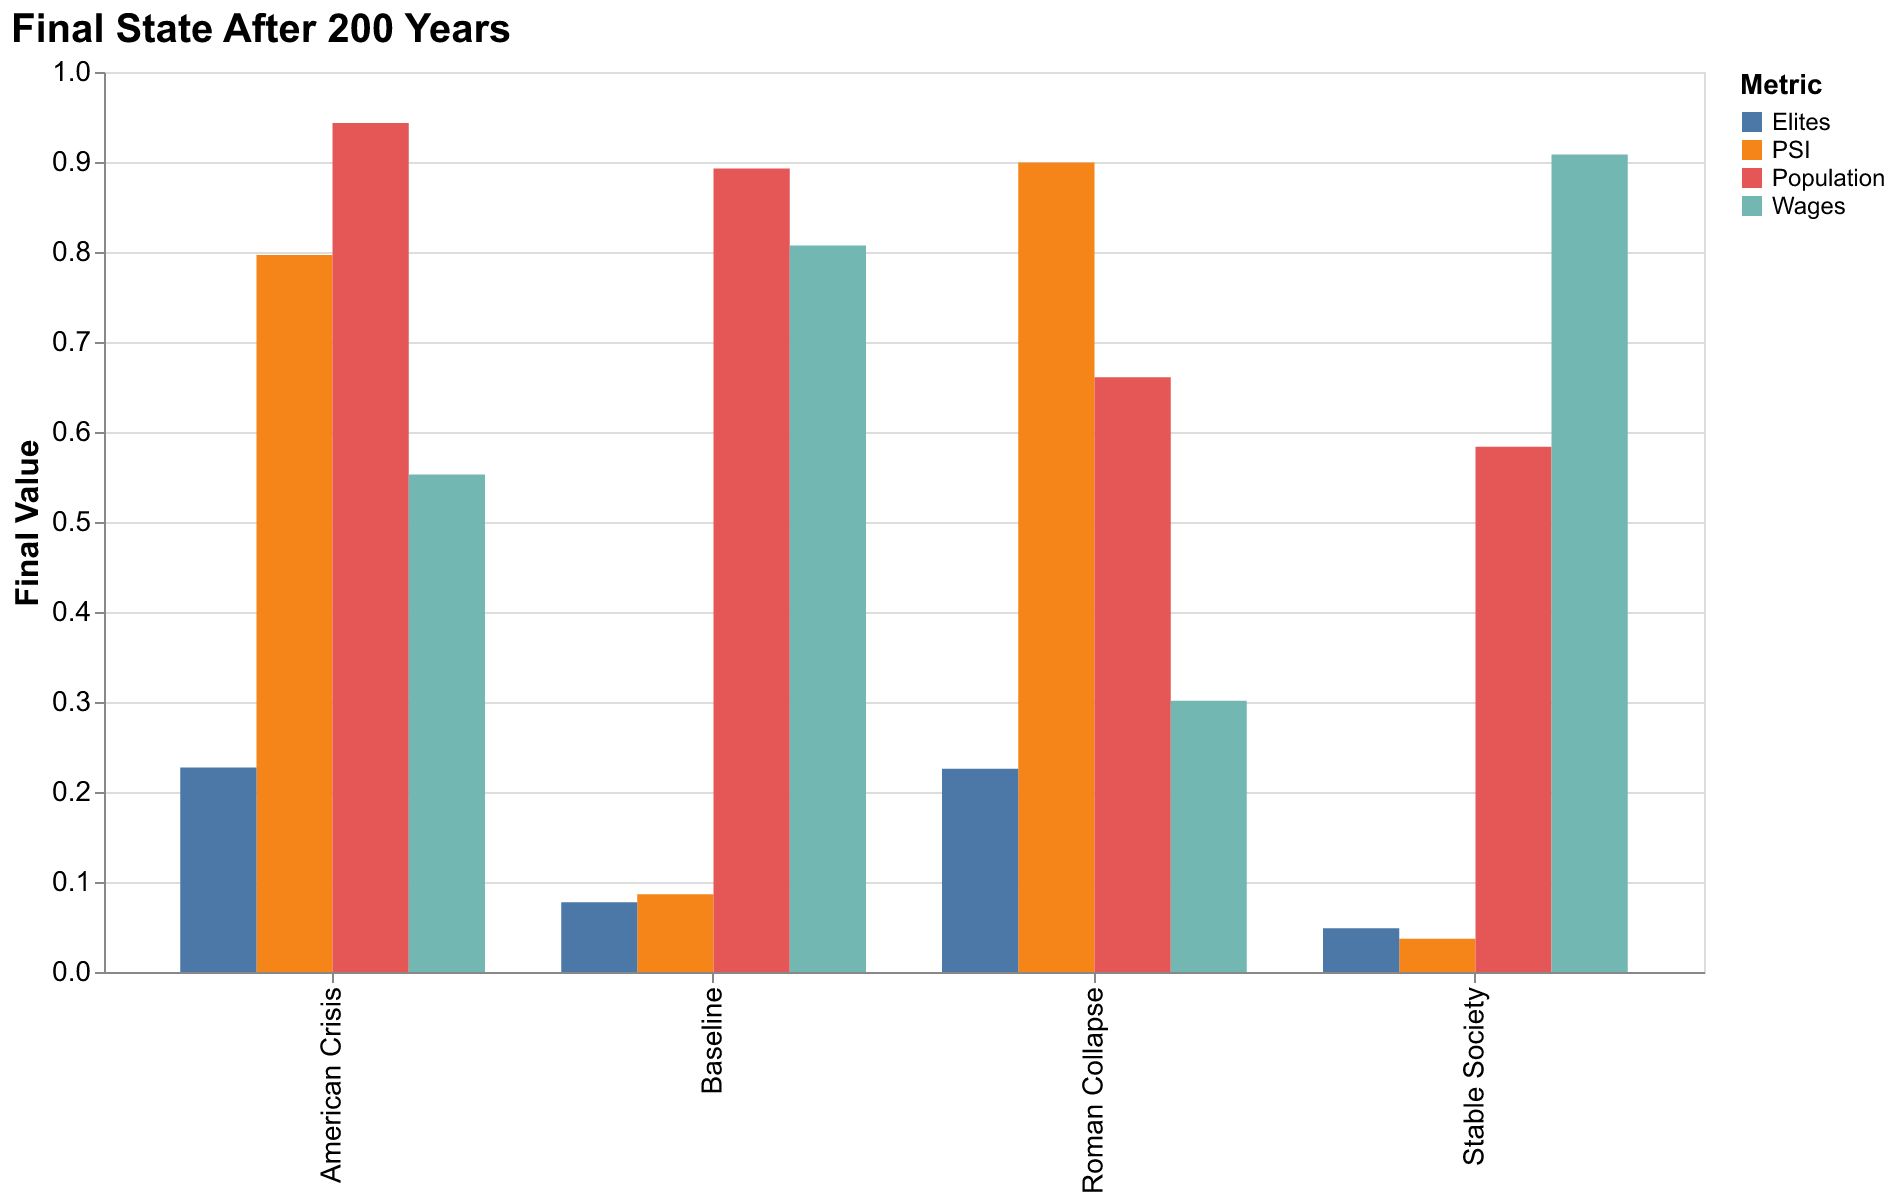
Above the visualizations you will find Summary Cards displaying the final values of each state variable at the end of the simulation. These give you quick numerical feedback without having to read values off the charts. The cards use color coding to highlight concerning states. When the Political Stress Index rises above the crisis threshold of 0.6, that card turns red, drawing your attention to the danger.
The status bar at the top of the control panel tells you the current state of the simulation. When you see a green dot and text like "Completed in 45ms", you know the current visualization reflects your parameter choices. If you see "Simulating...", the calculation is in progress. With auto-run enabled, you rarely see this state because simulations complete so quickly.
Understanding the State Variables
Before we examine the parameters that control the simulation, we need to understand what the simulation is actually modeling. Structural-Demographic Theory describes the evolution of five state variables through time. Each variable represents a measurable aspect of society, and their interactions generate the cyclical dynamics that Turchin identified in historical data.
Population, denoted N in the model and charts, represents the total number of people in the society. In our normalized model, this is measured relative to the carrying capacity, the maximum population the society's resources can sustainably support. A value of 1.0 means the society has reached its carrying capacity. Values below 1.0 indicate room for growth, while values approaching 1.0 signal a society pressing against its resource limits. Population growth is not constant. It depends on living standards, rising when times are good and falling when they are not.
Elites, denoted E, represents the population of those who hold social, economic, or political power. This is not just the aristocracy in a feudal sense but anyone who derives income primarily from property, position, or influence rather than labor. In modern societies, this includes business owners, senior professionals, politicians, and the wealthy. Elite population grows when surplus wealth allows upward mobility and contracts through mortality and downward mobility. The ratio of elites to available elite positions is a key driver of instability.
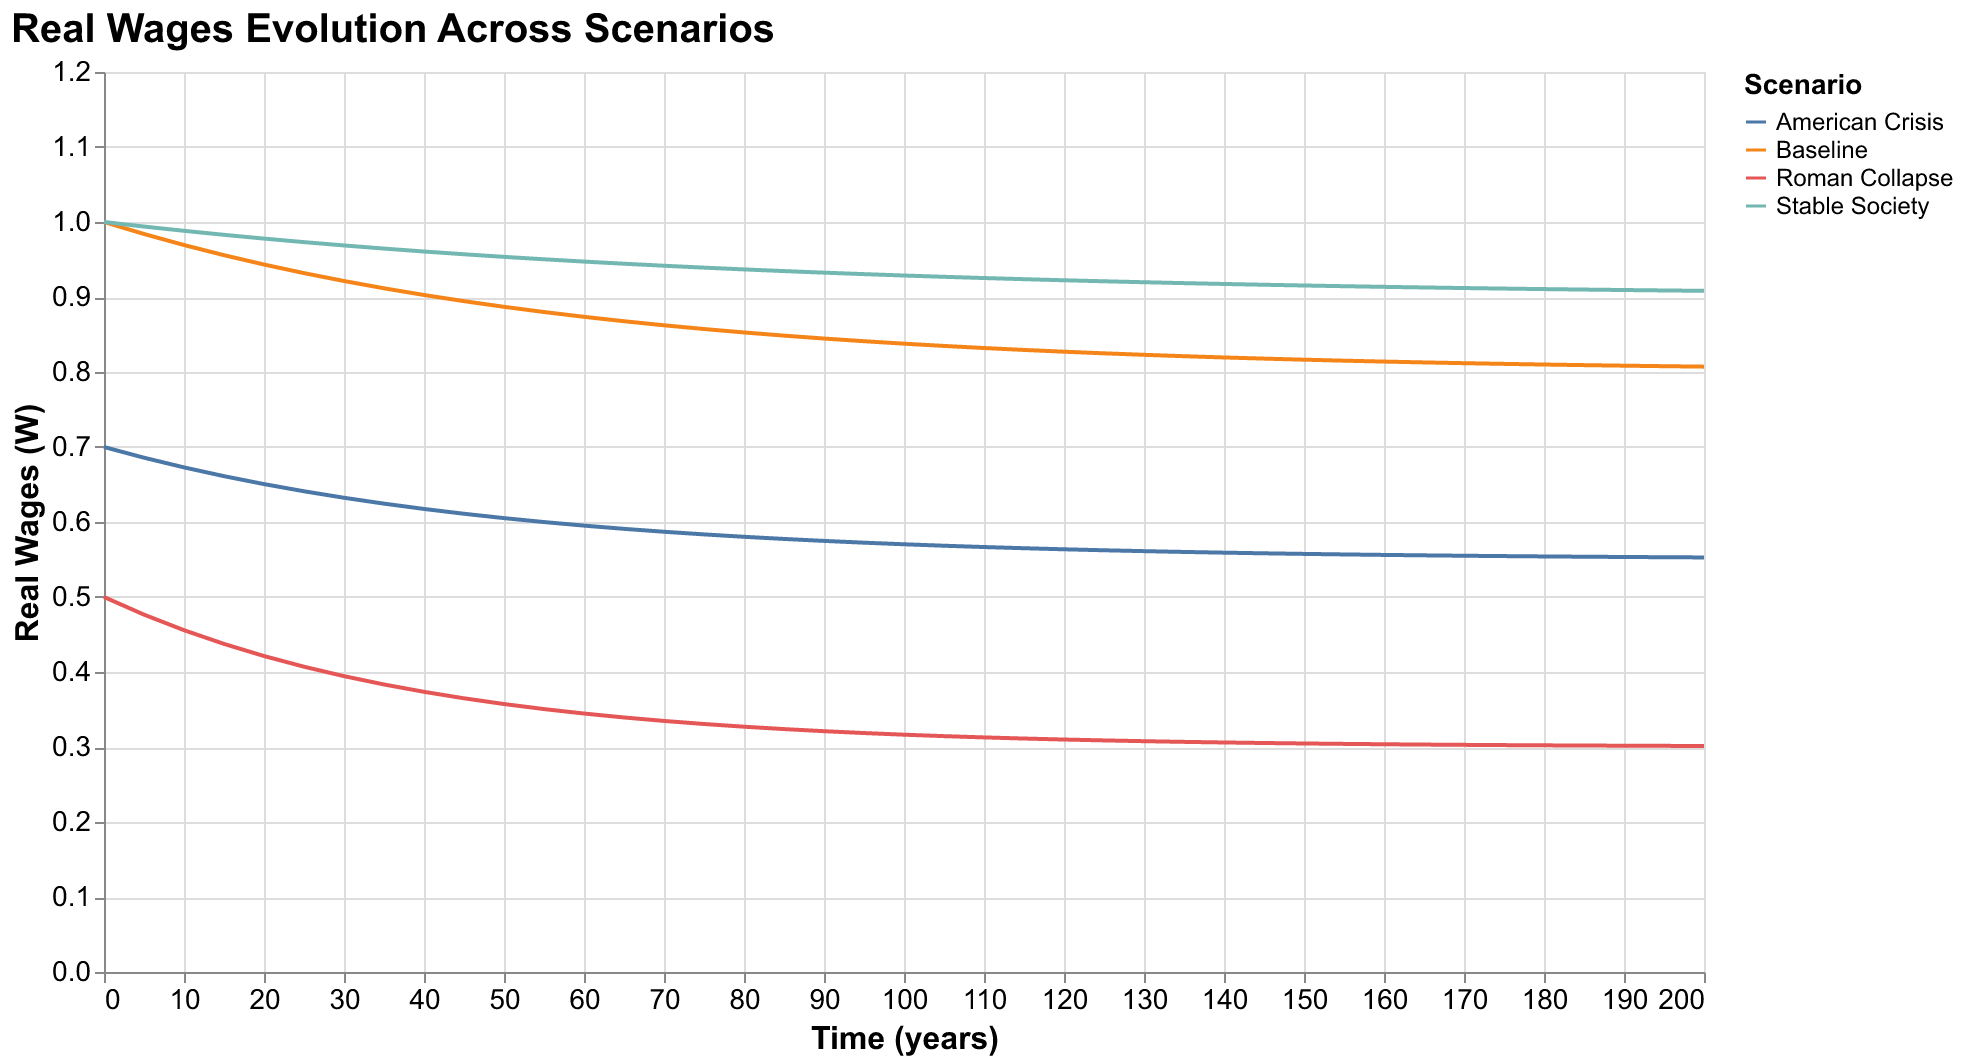
Wages, denoted W, represents real compensation for labor. This is normalized so that 1.0 represents a baseline level of worker welfare, typically the level that allows comfortable reproduction of the working population. When wages fall below this baseline, workers experience hardship. When wages rise above it, workers enjoy prosperity. Wages respond to the balance between labor supply and demand, falling when population grows faster than the economy and rising when labor becomes scarce.
State capacity, denoted S, represents the fiscal and administrative health of the government. A state with high S can collect taxes, maintain order, defend borders, and provide public goods. A state with low S struggles to function, unable to pay soldiers or administrators, losing control over its territory, and becoming vulnerable to internal and external threats. State capacity depends on the tax base (which grows with the economy) and the burden placed on the state by elite demands for patronage and positions.
Political Stress Index, denoted psi (the Greek letter), aggregates all the pressures pushing a society toward instability. It rises when wages fall, when elites proliferate beyond available positions, and when state capacity declines. It decays naturally when these pressures ease. The Political Stress Index is not a direct measure of instability but rather a measure of the structural conditions that make instability likely. When psi crosses the crisis threshold of 0.6, the model suggests the society has entered a danger zone where significant political violence, civil war, or state collapse become substantially more likely.
These five variables do not evolve independently. They form a coupled system where changes in one variable affect all the others. Population growth increases labor supply, which depresses wages. Low wages create surplus that elites can capture, fueling elite growth. Elite overproduction strains state resources and generates intense competition for limited positions. State weakness and elite conflict raise political stress, which can ultimately check population growth through violence and disorder. Understanding these feedbacks is the key to understanding cliodynamics.
The Parameters: What Each Slider Controls
Now we turn to the parameters themselves, the values you can adjust to explore different scenarios. These fall into two categories: initial conditions that set the starting point of the simulation, and model parameters that determine how the system evolves over time. Think of initial conditions as where you place a ball on a hill, and model parameters as the shape of the hill itself.
Initial Conditions
The five initial condition sliders set the values of each state variable at time zero. N (Population) defaults to 0.5, meaning the society starts at half its carrying capacity with substantial room for growth. E (Elites) defaults to 0.05, a small elite class relative to the total population. W (Wages) defaults to 1.0, baseline prosperity. S (State) defaults to 1.0, a functioning government. And psi (Instability) defaults to 0.0, no accumulated political stress.
Changing initial conditions lets you explore different starting points. A society that begins near carrying capacity with a large elite class and low wages is already under structural pressure. Even with moderate parameters, such a society may be destined for crisis. Conversely, a society starting with a small population, few elites, and high wages has room to grow before structural pressures accumulate. The same parameters can produce very different outcomes depending on where the simulation begins.
The relationship between initial conditions and outcomes is not always intuitive. You might expect that starting with higher wages would lead to better long-term outcomes. But higher wages also mean faster population growth, which eventually depresses wages and generates elite surplus. The system's feedbacks can turn short-term advantages into long-term problems. Experimenting with initial conditions reveals these counterintuitive dynamics.
Population Dynamics: r_max
The parameter r_max sets the maximum rate at which population can grow. This reflects the biological and social constraints on reproduction. Higher values mean faster potential population growth when conditions are favorable. The default value of 0.02 corresponds to a maximum annual growth rate of 2 percent, which is high by historical standards but represents what happens when agriculture is productive and disease is controlled.
Lowering r_max slows the entire system down. Population grows more slowly toward carrying capacity, giving more time for wages to remain high and for the society to adapt. Raising r_max accelerates everything, pushing the society faster toward the resource limits that trigger the demographic-structural crisis.
Elite Dynamics: alpha and delta_e
The parameter alpha controls upward mobility, the rate at which commoners become elites. When surplus wealth exists in the economy (because wages are below baseline), some of that surplus enables ambitious commoners to accumulate enough wealth, education, or connections to join the elite class. Higher alpha means more rapid elite growth when conditions permit.
The parameter delta_e controls elite attrition, the rate at which elites lose their status through mortality, impoverishment, or social decline. This provides a natural check on elite numbers. When alpha exceeds delta_e and surplus exists, the elite class grows. When attrition exceeds recruitment, it shrinks.
The ratio of alpha to delta_e largely determines whether a society will experience elite overproduction. If mobility is high and attrition is low, elites accumulate faster than positions open up for them. The resulting frustrated elite aspirants become a destabilizing force, seeking to displace incumbents or overthrow the system that denies them status.
Wage Dynamics: gamma and eta
The parameter gamma controls how strongly labor market conditions affect wages. When population is below carrying capacity, labor is relatively scarce, and wages rise. When population approaches carrying capacity, labor is abundant, and wages fall. Higher gamma means wages respond more strongly to these supply-demand dynamics.
The parameter eta controls elite extraction, how much elite competition depresses worker compensation. When the elite class grows relative to its baseline, elites compete more intensely for the available surplus, driving down what remains for workers. Higher eta means elite overproduction hurts worker welfare more severely.
These parameters determine how workers experience the demographic-structural cycle. With high gamma and eta, wages swing dramatically, falling sharply as population grows and elites multiply, then rising sharply during depopulation phases. With lower values, the wage trajectory is smoother but the underlying dynamics remain the same.
Instability Dynamics: lambda_psi and psi_decay
The parameter lambda_psi controls how quickly political stress accumulates when structural conditions worsen. When wages fall, elites multiply, and state capacity declines, stress builds up. Higher lambda_psi means faster accumulation, making societies more volatile.
The parameter psi_decay controls how quickly stress dissipates when conditions improve. Even without policy intervention, political tensions ease over time as grievances fade, movements lose momentum, and new generations come of age. Higher decay means faster return to stability when structural pressures lift.
The ratio of lambda_psi to psi_decay determines the volatility of the Political Stress Index. If accumulation greatly exceeds decay, stress builds rapidly and persists long after conditions improve. If decay is relatively high, society proves resilient, bouncing back quickly from structural pressures. Experimenting with these parameters reveals how different societies might respond to the same underlying stresses.
Reading the Visualizations
The Explorer presents its results through four complementary visualizations. Each reveals different aspects of the system's behavior, and learning to read them together gives you the fullest picture of what is happening in your simulated society.
The Time Series Chart
The main time series chart displays all five state variables plotted against time. The horizontal axis shows years, from zero to your chosen simulation duration (typically 200 years). The vertical axis shows the normalized value of each variable. Five colored lines trace the evolution of Population (blue), Elites (red), Wages (green), State capacity (purple), and Political Stress Index (orange).
When reading the time series, look for the relationships between variables. Does population growth precede wage decline? Do wages bottom out before political stress peaks? How long after elite numbers plateau does the state begin to weaken? These temporal relationships reveal the causal structure of the model. They show you which changes drive which effects, and with what lag.
The time series also reveals the shape of secular cycles. In a classic demographic-structural cycle, you will see population grow, wages fall, elites multiply, state capacity erode, and political stress rise. Then, if stress becomes high enough, some combination of reduced reproduction, increased mortality, and elite attrition reverses the trend. Population declines, wages recover, elite numbers contract, state capacity rebuilds, and stress dissipates. The cycle may then begin anew.
Not all parameter combinations produce clear cycles. Some lead to stable equilibria where all variables settle to constant values. Others produce explosive growth or collapse. Still others generate chaotic behavior with no discernible pattern. The time series shows you which regime your chosen parameters produce.
The Phase Space Charts
Phase space charts plot one variable against another, eliminating time to focus on the relationship between variables. A point on the chart represents the state of the system at a single moment. A line traces how that state evolves through time. The colors encode time, with early points in cool colors and late points in warm colors, letting you see which direction the trajectory flows.
The Explorer shows two phase space charts. The first plots Population against Wages, capturing the core Malthusian dynamic. In this space, the upper left (low population, high wages) represents favorable conditions: labor is scarce and well-compensated. The lower right (high population, low wages) represents unfavorable conditions: labor is abundant and cheap. A healthy society begins in the favorable region and may remain there. A society in crisis follows a trajectory that carries it toward the unfavorable region.
The second phase space chart plots Elites against Political Stress Index. The lower left (few elites, low stress) represents stability with a small, well-integrated elite class. The upper right (many elites, high stress) represents the crisis zone of elite overproduction and intense political conflict. Watching trajectories in this space shows you how elite dynamics drive instability.
Phase space charts are particularly useful for understanding cycles. A society undergoing a demographic-structural cycle traces a closed loop in phase space, returning eventually to conditions similar to its starting point. Stable societies converge to fixed points. Collapsing societies trace trajectories that head inexorably toward the crisis corner and stay there.
The Political Stress Index Chart
The final visualization focuses exclusively on the Political Stress Index, the most policy-relevant output of the model. The chart shows psi over time with the area under the curve filled in orange. A horizontal dashed line marks the crisis threshold at 0.6. When the curve crosses this line, a shaded region highlights the crisis period.
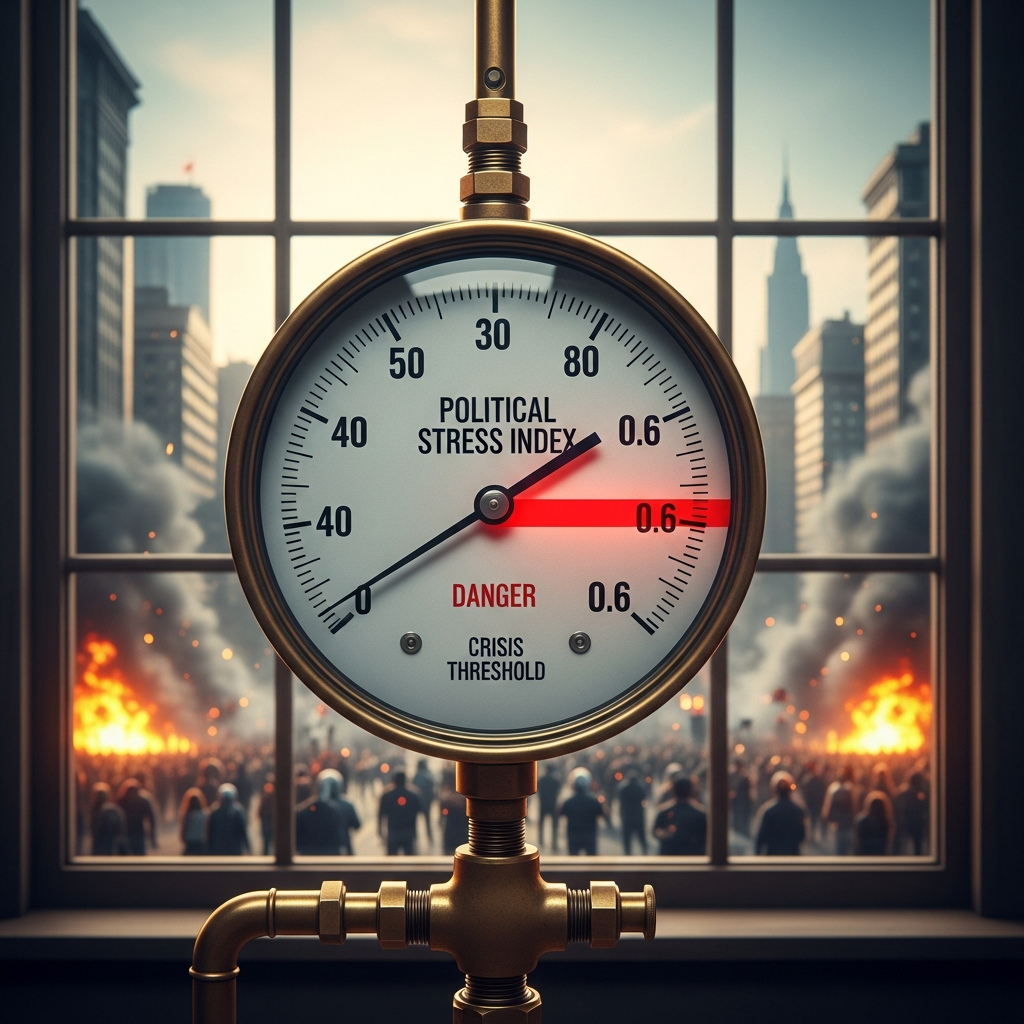
The crisis threshold is not a magical boundary where everything suddenly collapses. It represents Turchin's empirical finding that societies with Political Stress Index above 0.6 experienced significantly higher rates of political violence, civil conflict, and regime change. Think of it as entering a dangerous neighborhood: not every trip results in harm, but the risks are elevated.
When interpreting the PSI chart, pay attention to how quickly stress accumulates, how high it peaks, and how long it remains elevated. A brief spike above threshold followed by rapid decline suggests a manageable crisis. A sustained plateau in the danger zone suggests a prolonged period of instability. The shape of the curve tells you about the character of the crisis your simulated society faces.
Historical Presets: Learning from the Past
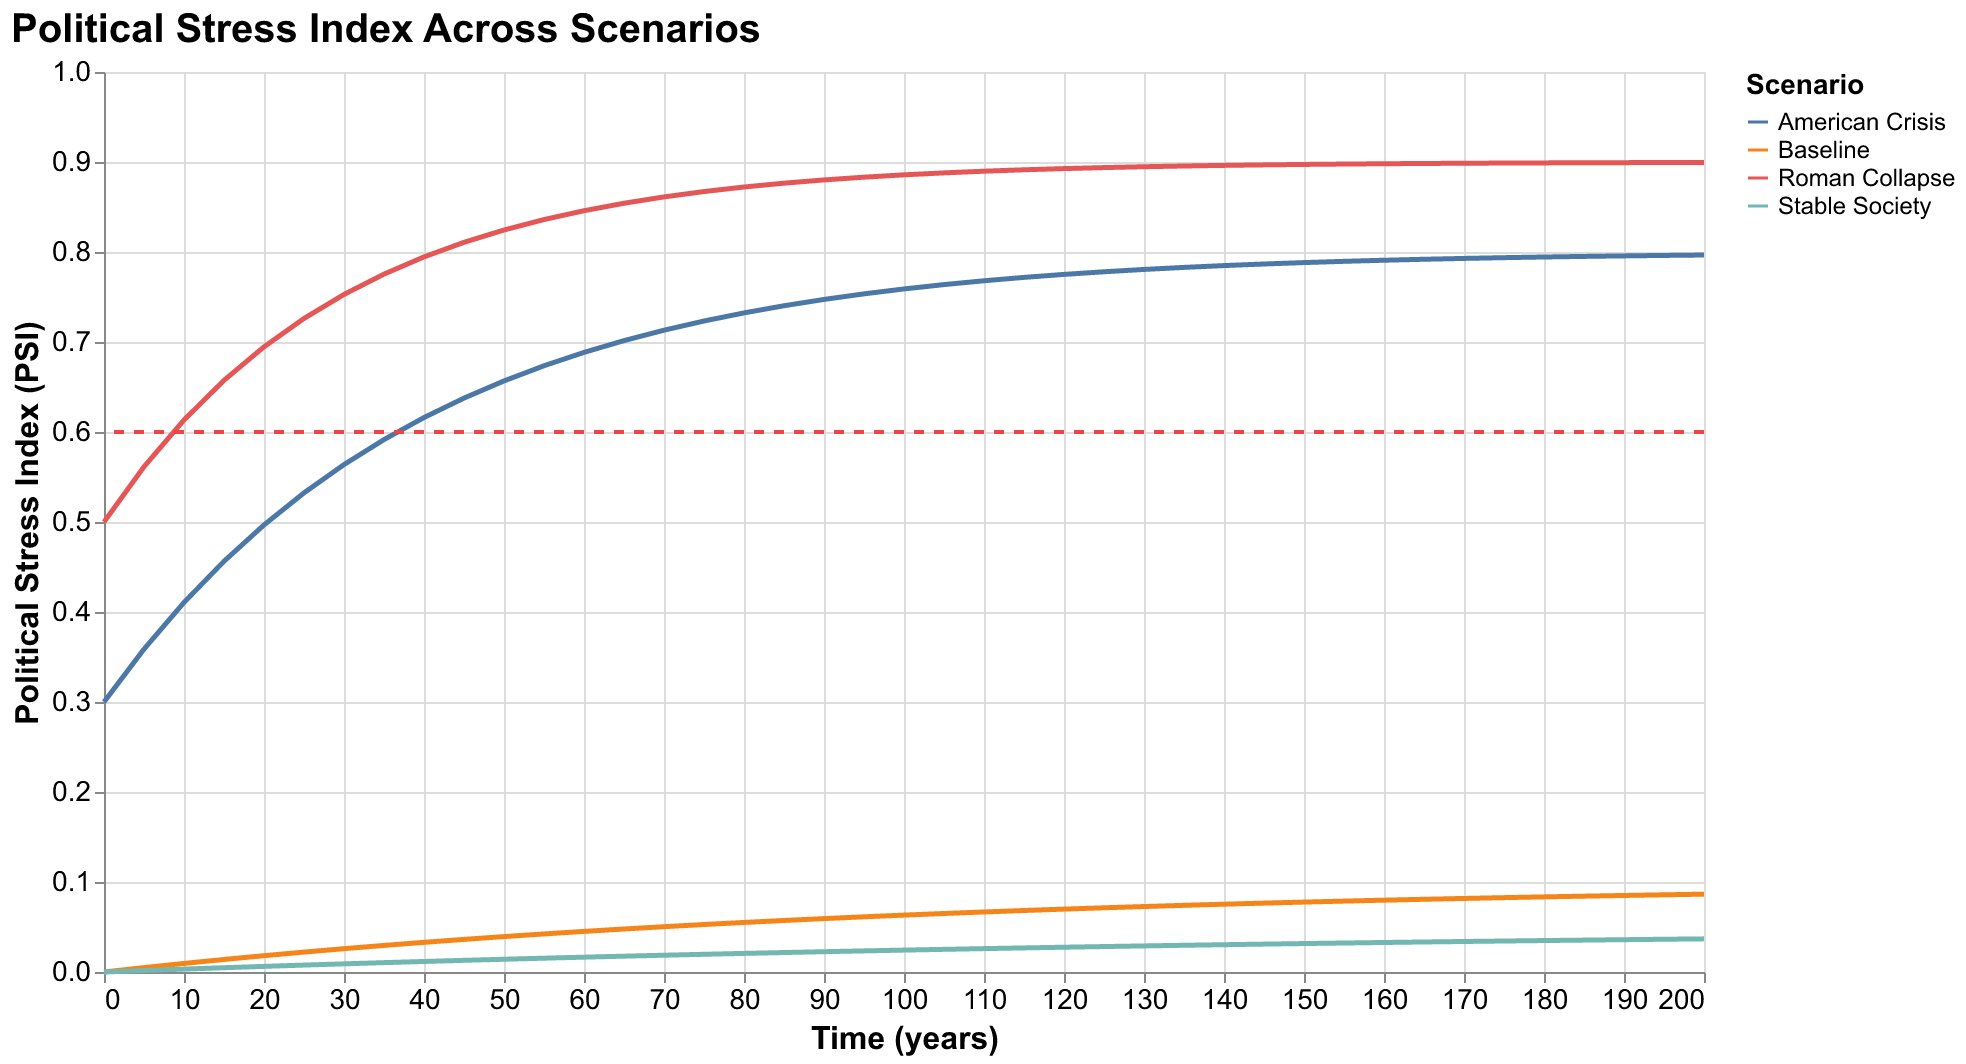
The Explorer includes four preset configurations that capture different historical scenarios. Each preset adjusts both initial conditions and model parameters to produce dynamics characteristic of specific historical situations. Using these presets is the fastest way to see the Explorer in action and to develop intuition about what different parameter regimes produce.
Stable Society
The Stable Society preset represents what happens when parameters align to produce sustainable dynamics. Elite mobility is low enough that overproduction never becomes severe. Population growth is moderate, giving the economy time to expand alongside the labor force. Political stress accumulation is slow, and decay is relatively fast.
Starting from favorable initial conditions (low population, small elite class, high wages), the Stable Society experiences gradual growth over two centuries but never approaches crisis. Population rises slowly toward carrying capacity. The elite class expands but remains proportionate to available positions. Wages decline moderately but stabilize well above distress levels. The Political Stress Index rises but peaks far below the crisis threshold.
This preset demonstrates that demographic-structural crises are not inevitable. With the right parameter combinations, societies can grow and develop without generating the feedback loops that lead to instability. The challenge for real societies is achieving and maintaining such parameter values in the face of technological change, cultural evolution, and external pressures.
American Crisis
The American Crisis preset models the dynamics Turchin identified in his analysis of the United States from 1970 to 2020. The simulation begins with a society already near carrying capacity, with an enlarged elite class, depressed wages, and some accumulated political stress. Elite mobility is high, reflecting the expansion of higher education and professional careers that created more aspirants to elite status than positions could accommodate.
From these initial conditions, the trajectory is concerning. Elite numbers continue to grow, intensifying competition for limited positions. Wages, already below baseline, fall further. Political stress, starting elevated, climbs steadily and crosses the crisis threshold within the first generation. The simulation suggests that without parameter changes, American-style dynamics lead to sustained instability.
This preset is particularly valuable for exploring counterfactuals. What if elite mobility were lower? What if wage pressures were eased? What if the state captured more of the elite surplus? By modifying individual parameters from the American Crisis baseline, you can explore what interventions might have altered the trajectory.
Roman Collapse
The Roman Collapse preset represents the dynamics of the late Western Roman Empire, particularly the crisis of the third century and the eventual fall. The simulation begins with conditions already dire: population near carrying capacity, a swollen elite class, severely depressed wages, weakened state capacity, and high initial political stress.
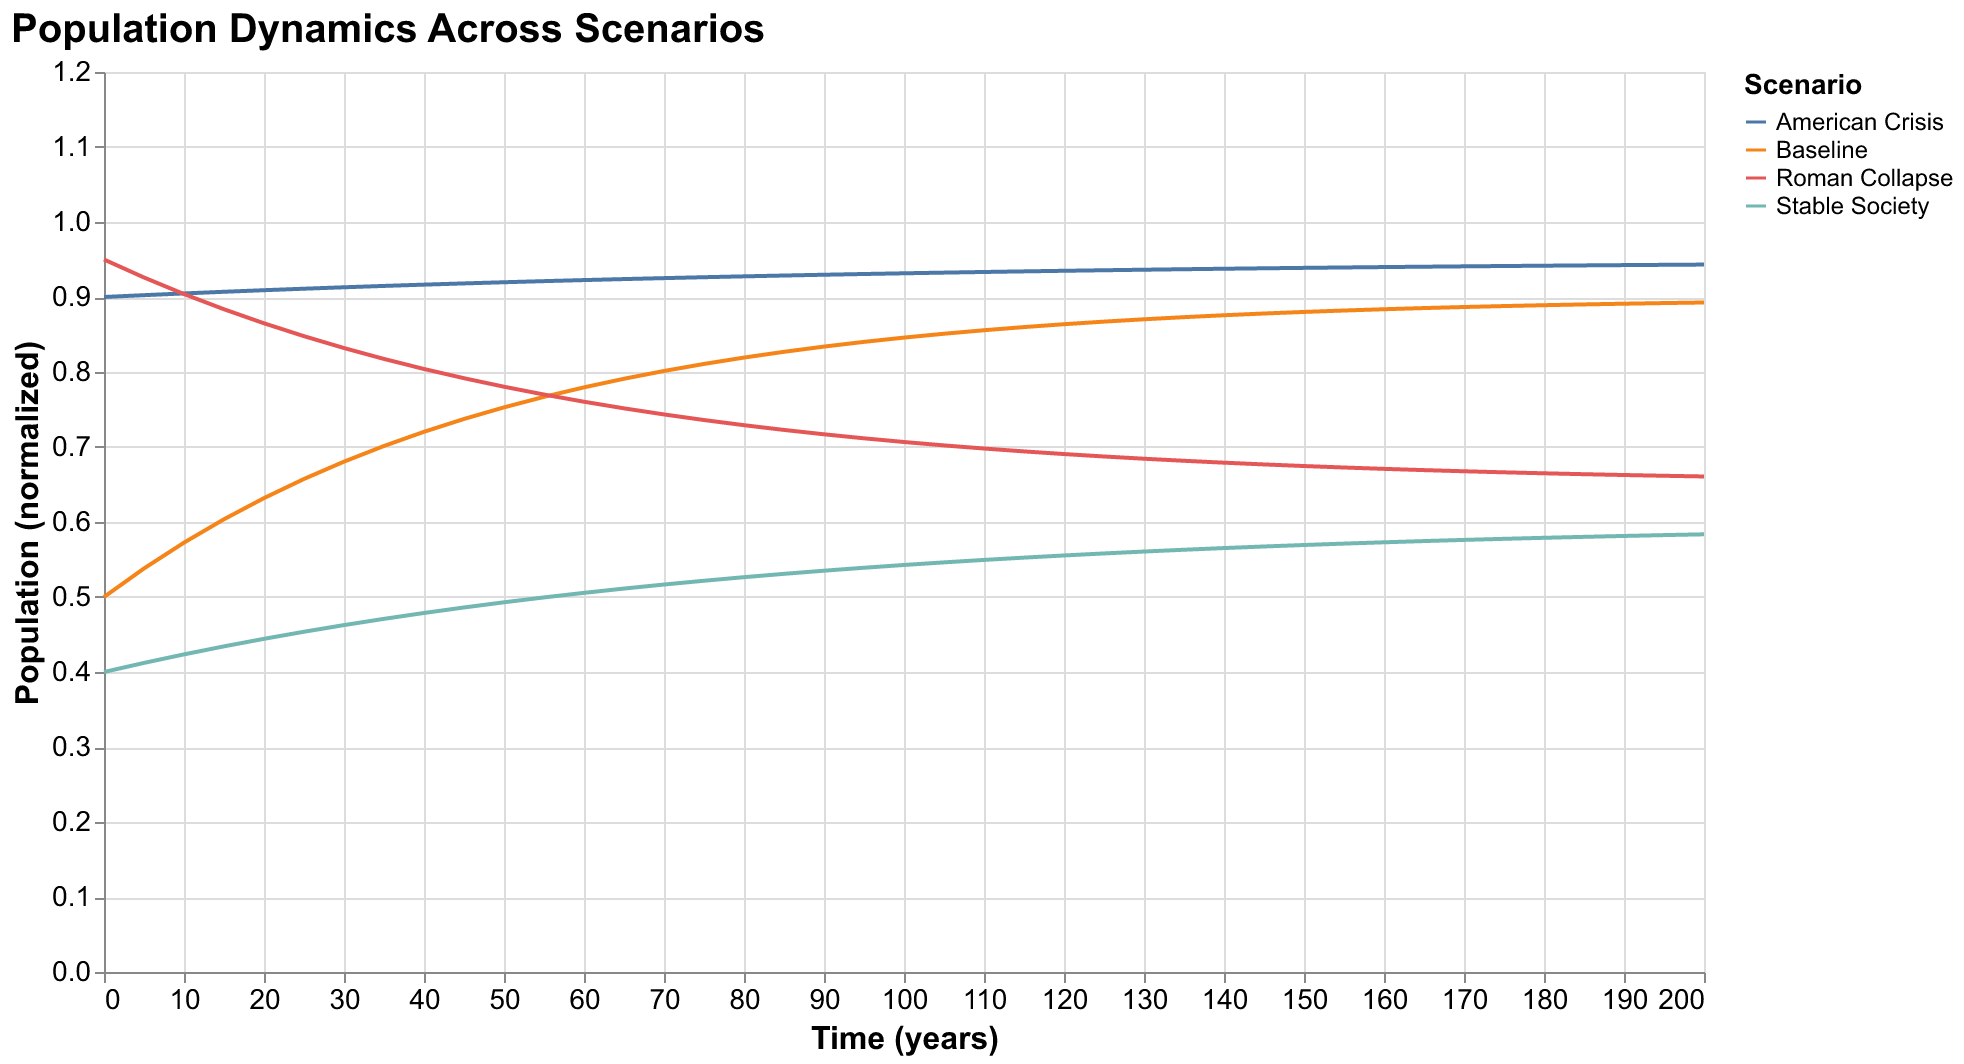
From these conditions, the trajectory shows systemic collapse. Population actually declines as conditions worsen. The elite class initially grows further (as desperate individuals seek refuge in status) before contracting as the system loses its ability to support them. Wages collapse to subsistence levels. State capacity, already weak, erodes further. Political stress rises to extreme levels and remains there.
This preset demonstrates the self-reinforcing dynamics of societal collapse. Once conditions deteriorate past certain thresholds, positive feedback loops take over. Weak states cannot suppress disorder, which further weakens the state. Depressed wages reduce the tax base, which reduces state capacity, which allows elites to extract more, which depresses wages further. Breaking out of such spirals requires dramatic intervention or simply playing out until population decline relieves the pressure.
Medieval Expansion
The fourth preset, Medieval Expansion, represents the opposite extreme from Roman Collapse. It models a society in the early expansion phase of a secular cycle, like Capetian France in the 11th and 12th centuries. Population is low, having been reduced by the previous cycle's crisis. The elite class is small. Wages are high because labor is scarce. State capacity is recovering. Political stress is minimal.
From these favorable starting conditions, the society experiences a golden age. Population grows steadily. The elite class expands but from such a low base that overproduction remains distant. Wages decline as population grows but remain above distress levels for generations. Political stress accumulates slowly, reaching the crisis threshold only at the end of the simulation period.
This preset shows what the beginning of a secular cycle looks like. The expansion phase is a period of prosperity, population growth, and political stability. But it plants the seeds of its own end: the population growth and elite formation that eventually produce the structural pressures leading to the next crisis. Understanding this dynamic helps explain why golden ages do not last forever.
Experiments to Try: Guided Explorations
Now that you understand the interface, the variables, the parameters, and the presets, it is time for hands-on exploration. The following experiments will help you develop intuition about how the model behaves and what drives different outcomes.

Experiment 1: The Effect of Elite Mobility
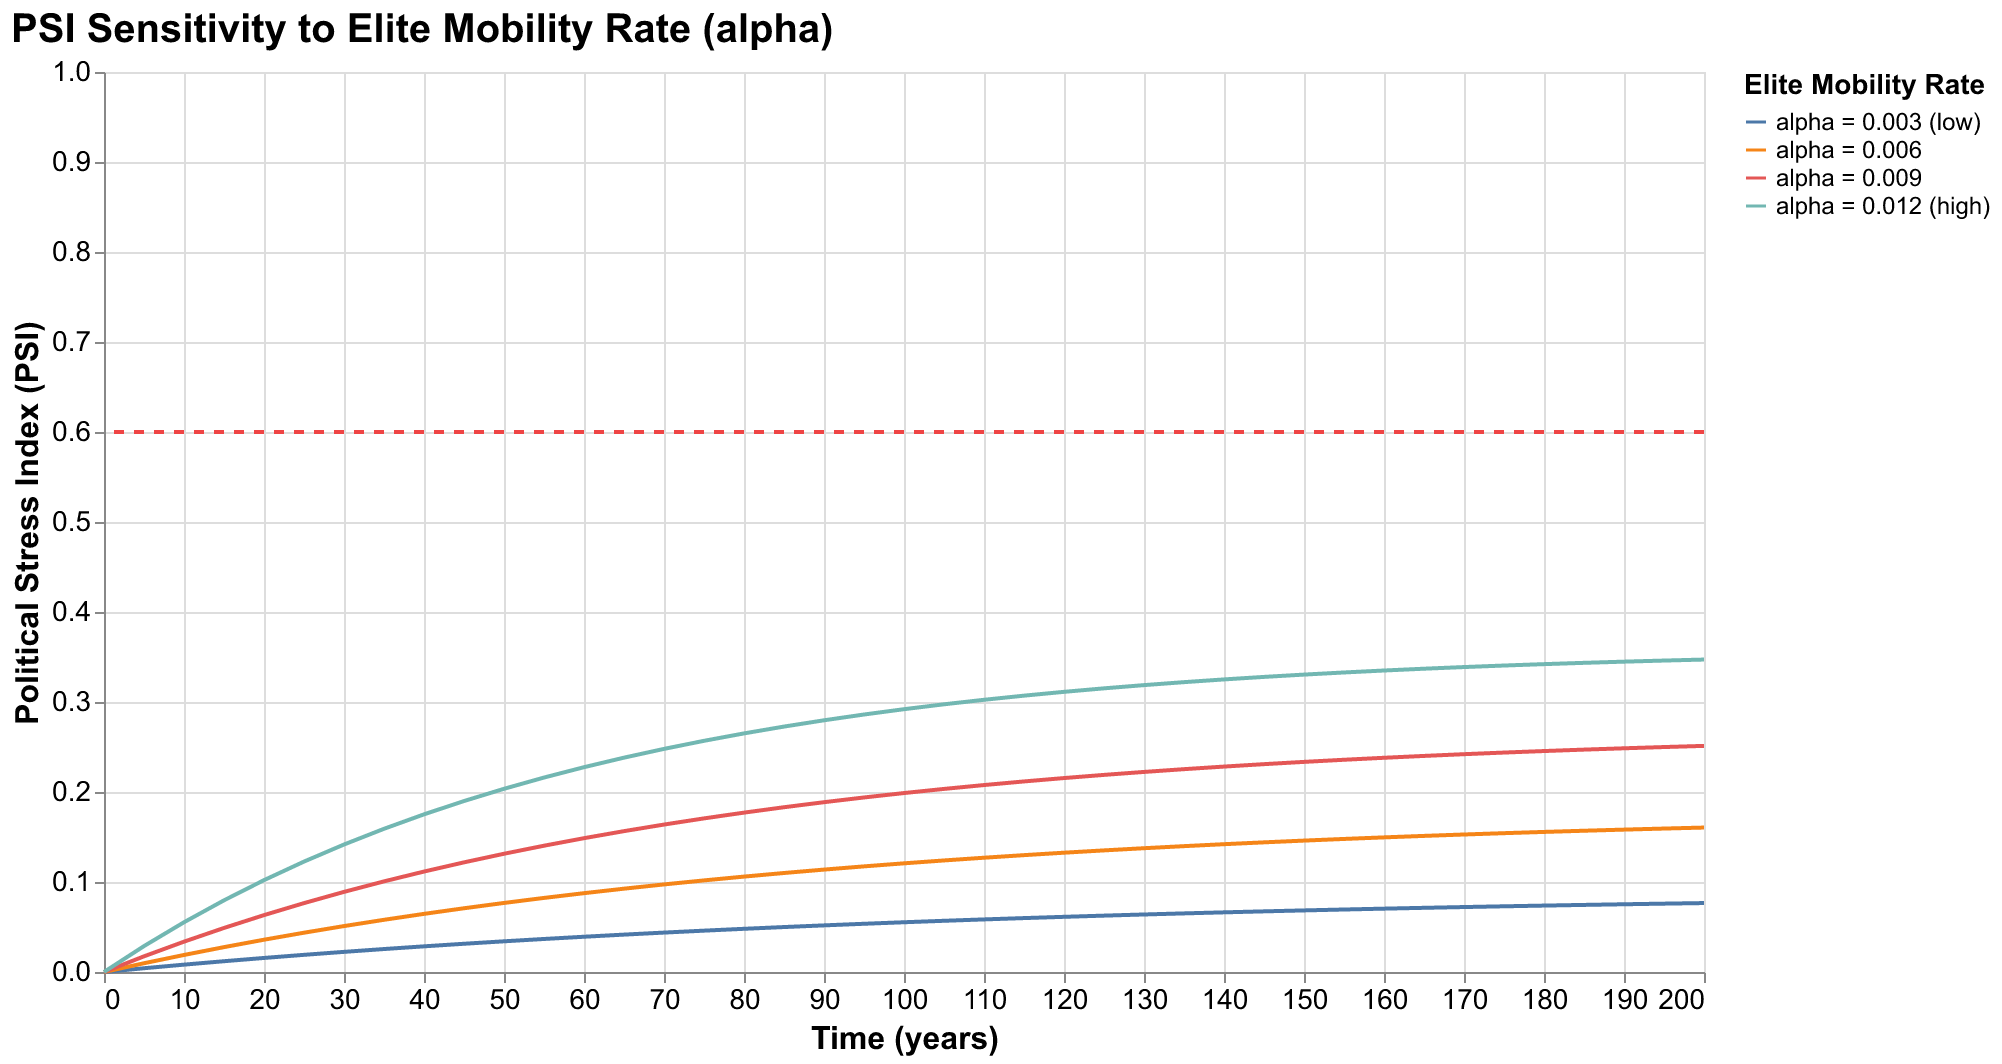
Start with the default baseline settings. Note the final Political Stress Index value. Now increase the alpha parameter (elite upward mobility) step by step from its default of 0.005 to 0.010, 0.015, and 0.020. Watch how the PSI trajectory changes with each increase.
What you should observe is that higher elite mobility leads to faster accumulation of political stress. With alpha at 0.005, the baseline society may never reach crisis. With alpha at 0.020, it crosses the threshold within a century. This experiment demonstrates the central role of elite overproduction in generating instability.
Now try the reverse experiment. Start with the American Crisis preset and reduce alpha. How much reduction is needed to keep PSI below threshold? This shows you how much the American trajectory would need to change in terms of elite production rates to avoid sustained crisis.
Experiment 2: Initial Conditions Matter
Return to baseline parameters but experiment with initial conditions. First, try starting with N at 0.9 instead of 0.5 (near carrying capacity). How does this change the trajectory? Next, try starting with high initial political stress (psi at 0.4). How does this affect outcomes?
What you should find is that starting conditions significantly affect outcomes even with identical parameters. A society near carrying capacity has less room to grow before structural pressures build. A society with existing political stress accumulates more from the same structural pressures. History matters: where you start shapes where you end up.
Experiment 3: The Race Between Stress and Decay
The Political Stress Index results from the balance between accumulation (controlled by lambda_psi) and decay (controlled by psi_decay). Start with baseline settings and observe the PSI trajectory. Now double lambda_psi while keeping psi_decay constant. Observe the change. Then return lambda_psi to default and double psi_decay instead. Compare these two experiments.
This experiment reveals the importance of societal resilience. High decay means society quickly recovers from structural stresses. Low decay means stresses persist and accumulate over generations. A society with high accumulation but also high decay may experience frequent minor crises. A society with low accumulation but also low decay may experience rare but prolonged crises. Understanding this trade-off illuminates real historical variations in political stability.
Experiment 4: Breaking the Roman Doom Loop
Load the Roman Collapse preset. The default trajectory leads to systemic collapse. Your challenge: modify parameters to save the empire. Can you find a combination of parameter changes that keeps the Political Stress Index below the crisis threshold?
This experiment is deliberately difficult. The Roman initial conditions are so adverse that only dramatic parameter changes can avert crisis. You might need to reduce elite mobility to near zero, dramatically increase state capacity parameters, or reduce the stress accumulation rate. Discovering what combination works teaches you about the constraints faced by declining societies.
Experiment 5: Creating Cycles
Try to find parameters that produce clear, repeating secular cycles in the time series. This typically requires moderate values across all parameters, not too extreme in any direction. Watch for the characteristic pattern: population growth, wage decline, elite expansion, state weakening, stress accumulation, crisis, depopulation, recovery, and renewal.
If you succeed in creating cycles, experiment with their period. Can you make cycles that last 100 years? 200 years? 300 years? The period depends on the time constants embedded in the parameters. Longer cycles mean slower dynamics, more gradual accumulation of pressures, and more time to potentially intervene.
Experiment 6: Sensitivity Analysis
Choose a baseline configuration that interests you, perhaps the American Crisis preset. Then systematically vary each parameter one at a time, noting how the final PSI changes. Which parameters have the largest effect? Which have minimal effect?
This sensitivity analysis reveals which aspects of the system most deserve attention. If a parameter has high sensitivity, small changes to the corresponding real-world quantity could have large effects on stability. If a parameter has low sensitivity, even dramatic changes would matter little. This information is valuable for thinking about policy priorities.
Interpreting Results: What Rising PSI Really Means
When you observe the Political Stress Index rising in your simulations, what should you conclude? The PSI is not a direct prediction of revolution, civil war, or collapse. It is a measure of structural pressure, the accumulated weight of demographic and elite dynamics pressing on the political system. Understanding what PSI captures, and what it does not, is essential for properly interpreting Explorer results.
High PSI indicates that structural conditions exist for instability. Wages have fallen, creating economic grievances among workers. Elites have proliferated, creating frustrated aspirants who cannot find positions matching their expectations. State capacity has weakened, reducing the system's ability to absorb shocks or suppress disorder. All three of these conditions make political instability more likely, though none guarantees it.
The crisis threshold at 0.6 represents an empirically derived boundary. In his analysis of historical societies, Turchin found that periods with PSI above this threshold experienced significantly elevated rates of political violence, attempted coups, civil wars, and regime changes. But elevated risk is not certainty. Some high-PSI periods passed without catastrophe. Some low-PSI periods experienced unexpected instability from causes the model does not capture.
Think of PSI as analogous to blood pressure in medicine. High blood pressure does not mean you will definitely have a heart attack tomorrow. It means your risk is elevated, and the longer it stays elevated, the more likely something bad will eventually happen. Normal blood pressure does not guarantee health, but it is a favorable sign. PSI works the same way for societies.
When interpreting specific simulations, avoid the temptation to read too much precision into the numbers. The model captures structural dynamics that operate over decades and centuries. It says nothing about what will happen next year or who will be president in 2032. It says that certain configurations of population, elites, wages, and state capacity create elevated instability risk, and that this risk tends to manifest eventually through some form of political crisis.
The most valuable use of PSI is comparative rather than absolute. Comparing two policy scenarios and finding that one produces PSI of 0.4 while the other produces 0.7 tells you that the first is structurally more stable than the second. This relative comparison holds even if the absolute numbers are not precisely calibrated to any particular society.
The Model's Limitations: What the Explorer Cannot Tell You
Every model is a simplification of reality, and the SDT model implemented in the Explorer is no exception. Understanding its limitations helps you use it appropriately and avoid overinterpreting its results.

The model treats society as a closed system evolving according to internal dynamics. It has no mechanism for external shocks: no invasions, no plagues, no volcanic eruptions, no technological revolutions arriving from outside. Real societies experience all of these, and they can dramatically alter trajectories in ways the model cannot anticipate. A society that appears stable in the Explorer might collapse if struck by pandemic. A society approaching crisis might find relief through conquest or discovery of new resources.
The model has no geography. It treats the entire society as a single, homogeneous unit. Real societies have regions, cities, peripheries, and variations in conditions across space. Instability might concentrate in certain areas while others remain peaceful. The model cannot capture this spatial dimension of political dynamics.
The model has no individual actors. It describes aggregate dynamics, not the decisions of kings, generals, reformers, or revolutionaries. Great individuals can sometimes alter trajectories that structural forces seem to determine. A wise reformer might implement policies that defuse elite overproduction before it generates crisis. A reckless ruler might trigger instability in otherwise stable conditions. The model has no way to represent such individual agency.
The model treats elites as a single, homogeneous group. In reality, elites fragment into factions with different interests and strategies. Elite conflict is not just about the number of elites versus positions but about which elites ally with which others, which factions control which resources, and how inter-elite struggles interact with popular grievances. The model's single elite variable cannot capture this complexity.
The model has no culture, ideology, or identity. Real political instability often follows ethnic, religious, or ideological lines. Grievances get channeled into movements with particular programs and identities. The model treats all political stress as fungible, missing the crucial role that ideas and identities play in mobilizing discontent.
The parameters themselves embody assumptions that may not hold across all societies or time periods. The relationship between population and wages, for example, assumes a certain kind of agricultural or industrial economy. The relationship between elite numbers and political stress assumes certain institutional configurations. Applying the model to societies very different from those Turchin studied may yield misleading results.
Finally, the model is not a forecasting tool in any predictive sense. It identifies structural tendencies, not specific outcomes. A simulation showing crisis by year 150 does not mean real crisis will occur in exactly that timeframe. Real events depend on contingencies the model cannot capture. Use the Explorer to think about forces and tendencies, not to make predictions about specific events.
Connecting to Our Other Essays
The Explorer does not exist in isolation. It implements the mathematical framework described in our essay on "The Mathematics of Societal Collapse," where we explain the differential equations in detail. If you want to understand why the equations take the form they do, that essay provides the technical foundation.
The presets connect to our case study essays. The American Crisis preset implements the dynamics analyzed in "America in the Balance," where we applied SDT to U.S. history from 1780 to 2025. The Roman Collapse preset relates to "Rome: From Republic to Ruin," our analysis of the Roman Empire through the SDT lens. Reading these essays alongside Explorer experimentation deepens your understanding of both.
The parameters and their sensitivities connect to "Finding the Right Numbers: Parameter Calibration in Cliodynamics," where we discuss how parameter values are estimated from historical data. Understanding calibration helps you appreciate what the parameter sliders represent and why their ranges are set as they are.
The uncertainty inherent in any single simulation connects to "Embracing Uncertainty: Monte Carlo Methods for Honest Forecasting." The Explorer shows deterministic trajectories, but real forecasting requires considering the range of possible outcomes given uncertainty in parameters and initial conditions. That essay explains our approach to probabilistic analysis.
Finally, the policy implications of what you observe in the Explorer connect to "Steering the Ship: Policy Lessons from Cliodynamics." That essay discusses what real-world interventions might alter the trajectories the model reveals. When you experiment with parameters in the Explorer and find configurations that avoid crisis, you are essentially exploring the solution space for policy intervention.
Technical Details: How the Explorer Works
For those interested in the technical implementation, the Explorer is built entirely in TypeScript using the React framework for user interface components and Plotly.js for interactive charting. The simulation itself runs directly in your web browser, with no server-side computation required. This architecture ensures fast response times and complete privacy, since your parameter choices never leave your device.
The core simulation uses a fourth-order Runge-Kutta numerical integration scheme. This method provides a good balance between accuracy and computational speed, accurately resolving the continuous dynamics of the differential equations while completing 200-year simulations in tens of milliseconds. The integration uses a time step of 0.5 years internally, outputting values at each step for visualization.
The state variables are normalized for numerical stability. Population is measured relative to carrying capacity, so values typically range from 0 to 1.2. Elites are measured as a fraction of population. Wages and state capacity are normalized to baseline values of 1.0. Political stress is bounded below by zero. These normalizations ensure that the numerical integration remains well-conditioned across the parameter ranges the Explorer supports.
The preset configurations were developed by manual calibration to historical case studies. The American Crisis preset, for example, was tuned to reproduce the qualitative dynamics Turchin describes in "Ages of Discord," including the timing and severity of political stress accumulation from 1970 to 2020. The Roman preset similarly aims to capture the dynamics of the late Western Empire as analyzed in "Secular Cycles."
The Explorer source code is available in the project's GitHub repository. It is structured modularly, with separate files for the model equations, parameter definitions, React components, and charting logic. This modular structure makes it straightforward to extend the Explorer with new features, alternative model formulations, or additional presets.
A Walkthrough: Your First Session
Let us walk through a complete Explorer session from start to finish, demonstrating the workflow for investigating a question using the tool.
Suppose we want to understand the role of elite dynamics in the American crisis. We start by loading the American Crisis preset to establish our baseline. The charts populate immediately, showing a society that enters and remains in the crisis zone within the simulation period. The final PSI is around 0.8, well above threshold. This is our baseline trajectory to improve upon.
Our first hypothesis is that reducing elite mobility would help. We locate the alpha slider in the Model Parameters section. Its current value is 0.008, elevated compared to the baseline 0.005. We reduce it step by step, watching the PSI chart after each change. At 0.006, PSI still crosses threshold but peaks lower. At 0.004, it barely touches threshold. At 0.003, it stays entirely below.
We have discovered that reducing elite mobility by a factor of roughly 2.5 would be sufficient to keep the American scenario out of persistent crisis, at least according to this model. But is that feasible in reality? That depends on real-world mechanisms: educational policy, credential inflation, immigration patterns, and more. The model tells us the target; achieving the target requires understanding mechanisms it does not capture.
Let us try an alternative intervention. We reload the American Crisis preset to restore baseline conditions, then look at the state capacity parameters. The rho parameter controls how much revenue the state collects from economic output. The default is 0.2 (20 percent tax rate on output). What if the state captured more surplus?
We increase rho to 0.25, then 0.30. Each increase improves state capacity S over time, which reduces the state weakness contribution to PSI. But the effect is modest. Even with rho at 0.30, PSI still crosses threshold, just later and lower. State revenue alone cannot solve the problem because it does not address the underlying elite overproduction.
This leads us to a combined intervention. We reduce alpha to 0.005 (moderate but not extreme reduction in elite mobility) and increase rho to 0.25 (moderate increase in state revenue). The combination keeps PSI below 0.6 throughout the simulation. Neither intervention alone was sufficient, but together they work.
We have learned something from this session: the American-style trajectory requires addressing elite dynamics, not just strengthening the state. State capacity helps but cannot substitute for managing elite overproduction. This insight emerges from interactive exploration in a way that reading about parameters never quite achieves.
Advanced Topics: Beyond the Basics
Once you are comfortable with basic Explorer use, several advanced topics await exploration.
Bifurcations and Tipping Points
Some parameter changes produce discontinuous shifts in system behavior. As you slowly increase a parameter, the trajectory might change gradually until suddenly it jumps to a qualitatively different pattern. These bifurcation points are where the system's phase space structure changes. Finding them requires careful parameter sweeps, slowly varying a single parameter while watching for sudden changes in behavior.
Sensitivity to Initial Conditions
For some parameter regimes, the final outcome is highly sensitive to starting conditions. Two simulations with nearly identical initial conditions diverge dramatically over time. This is a signature of chaotic dynamics, where the long-term future becomes fundamentally unpredictable. Identifying chaotic regimes helps you understand when forecasting is fundamentally limited.
Equilibrium Analysis
Some parameter combinations lead to stable equilibria where all variables converge to constant values. These fixed points represent sustainable societal configurations. Analyzing which parameter combinations produce stable equilibria, and what those equilibrium values are, reveals the conditions for long-term stability.
Cycle Period and Amplitude
For parameter regimes that produce cyclical behavior, you can measure the period (time between successive crises) and amplitude (how high PSI peaks, how low wages bottom out). These cycle characteristics vary with parameters, and understanding the variation helps you think about why different historical societies experienced cycles of different lengths and severities.
Historical Context: Why These Equations Matter
The mathematical framework implemented in the Explorer did not emerge from abstract theorizing. It grew from decades of quantitative historical research, painstaking data collection, and careful comparison of societies across millennia. Understanding this context helps you appreciate what the Explorer represents and why its particular formulation captures dynamics that matter.
Peter Turchin began his career as an ecologist, studying the population dynamics of insects and other organisms. Ecological systems exhibit cycles: predator populations rise when prey is abundant, then crash when they exhaust their food supply, allowing prey to recover and starting the cycle anew. Turchin wondered whether similar dynamics might explain the cycles of growth and crisis he observed in human history. The population boom and bust of Rome, the rise and fall of Chinese dynasties, the expansion and contraction of medieval European kingdoms all seemed to follow rhythms reminiscent of ecological cycles.
But human societies are not simple predator-prey systems. The dynamics are mediated by social structures, political institutions, economic arrangements, and cultural beliefs. The key insight that distinguishes Structural-Demographic Theory from simple Malthusian models is the role of elites. In Malthus's original formulation, population grows until it hits resource limits, wages fall to subsistence, and population growth stops or reverses through famine and disease. This simple model captures some historical episodes but misses others entirely. Many historical crises occurred not at resource limits but in societies with surplus productive capacity. What caused instability in these cases was not mass starvation but political conflict among elites.
The elite variable in our model captures this crucial distinction. Elites compete for positions of power and prestige, not just for food. When the number of elite aspirants exceeds available positions, the resulting frustration and conflict generates political instability even if the peasants have enough to eat. The Crisis of the Third Century in Rome, the English Civil War, the French Revolution, and many other upheavals occurred in societies where the fundamental problem was too many people competing for too few positions at the top of the hierarchy, not too many mouths to feed at the bottom.
Turchin and his colleague Sergey Nefedov tested these ideas against historical data from multiple societies: Rome, medieval and early modern England, France, Russia, and others. They found that the demographic-structural model with elite dynamics fit the historical patterns far better than simple population models. The timing of instability peaks, the duration of cycles, the relationship between wages and violence all matched the model's predictions. This empirical validation gives the framework credibility that purely theoretical constructs lack.
The Explorer implements equations refined through this iterative process of theory development and empirical testing. When you adjust the alpha parameter controlling elite mobility, you are manipulating a quantity that historical research has shown to be crucial in determining societal stability. When you watch the Political Stress Index rise as elites proliferate, you are seeing the same dynamic that drove the violence of revolutionary France and the turmoil of late Republican Rome. The mathematics is not arbitrary; it encodes patterns discovered through careful historical analysis.
This historical grounding has implications for how you should use the Explorer. The model is not a universal law of societal dynamics valid for all possible civilizations. It is a distillation of patterns observed in agrarian and early industrial societies with certain institutional structures. Applying it to hunter-gatherer bands or to hypothetical post-scarcity futures might yield nonsensical results. Within its domain of applicability, though, the model captures something real about how societies work, something validated by its ability to reproduce historical patterns across multiple independent cases.
The Mathematics in Detail: Understanding the Equations
For readers who want a deeper understanding of what the Explorer calculates, this section explains the mathematical structure underlying the simulation. You do not need to understand these equations to use the Explorer effectively, but knowing what they say can help you understand why the system behaves as it does.
The model consists of five coupled ordinary differential equations, one for each state variable. Each equation specifies how that variable changes based on the current values of all five variables. Let us examine each in turn.
Population dynamics follow a modified logistic equation. The standard logistic equation describes population growth that slows as population approaches carrying capacity, reaching zero growth when N equals K (the carrying capacity). Our equation modifies this by making the growth rate depend on wages. When wages are high (W greater than the baseline W_0), the effective growth rate increases because workers can afford better nutrition, healthcare, and family support. When wages are low, growth slows or becomes negative. Mathematically, we multiply the base growth rate r_max by a power of the wage ratio (W/W_0), raised to the exponent beta. This wage-dependent growth rate captures the Malthusian feedback: population growth increases labor supply, which depresses wages, which slows population growth.
Elite dynamics depend on upward mobility and attrition. Upward mobility represents commoners becoming elites through wealth accumulation, professional advancement, or political rise. In the model, the rate of upward mobility depends on the surplus available for accumulation, which is higher when wages are depressed (more surplus for elites to capture) and when population is large (more individuals attempting to rise). The parameter alpha scales this effect. Attrition represents elites leaving the class through death, impoverishment, or social decline, and proceeds at rate delta_e times the current elite population. When upward mobility exceeds attrition, the elite class grows; when attrition exceeds mobility, it shrinks.
Wage dynamics balance labor supply and elite extraction. When population is below carrying capacity, labor is relatively scarce, and wages tend to rise. The parameter gamma controls the strength of this supply-demand effect. Simultaneously, elite expansion increases competition for surplus, driving down what remains for workers. The parameter eta controls how strongly elite numbers affect wages. The wage equation combines these effects multiplicatively, with wages rising when labor is scarce and falling when elites proliferate.
State capacity depends on revenue and expenditure. Revenue is proportional to economic output (approximated as wages times population), with the parameter rho determining the effective tax rate. Expenditure includes baseline costs (proportional to state capacity itself, scaled by sigma) and elite burden (proportional to elite population, scaled by epsilon). When revenue exceeds expenditure, state capacity grows; when expenditure exceeds revenue, it declines. Elite overproduction strains the state both by reducing the tax base (through wage depression) and by increasing demands for patronage and positions.
Political stress accumulates from three sources: wage depression, elite overproduction, and state weakness. Each source contributes positively to stress when conditions deviate from baseline in the unfavorable direction. Low wages relative to baseline increase popular grievances. High elite numbers relative to baseline increase elite competition. Low state capacity relative to baseline reduces the system's ability to manage conflict. The parameter lambda_psi scales the overall rate of stress accumulation, while theta_w, theta_e, and theta_s weight the relative contributions of each source. Stress also decays naturally at rate psi_decay, representing the fading of grievances and cooling of conflicts over time when structural pressures ease.
These five equations form a coupled system where changes in any variable ripple through all the others. The coupling creates the complex dynamics you observe in the Explorer: cycles, equilibria, collapse, and sensitive dependence on parameters and initial conditions. Numerical integration using the Runge-Kutta method traces how the state variables evolve through time given any chosen parameters and starting point. This is what the Explorer calculates when you adjust a slider and wait the fraction of a second for the new visualization to appear.
Connecting Parameters to Real-World Quantities
The parameters in the Explorer have abstract names like alpha, gamma, and lambda_psi. But each corresponds to real-world quantities that policy makers might potentially influence. Understanding these connections transforms the Explorer from a mathematical toy into a tool for thinking about intervention.
Consider alpha, the upward mobility parameter. In the real world, upward mobility depends on education systems, labor markets, inheritance patterns, immigration, and credential inflation. Societies with open access to education and professional credentials tend to have higher alpha: more people can acquire the qualifications needed to join the elite class. Societies with hereditary aristocracies or rigid caste systems have lower alpha: elite status passes primarily through birth, with few outsiders entering.
Modern developed nations have experienced dramatic increases in alpha over the past century. Mass higher education, credential proliferation, and the expansion of managerial and professional occupations have created unprecedented opportunities for upward mobility. The Explorer shows what this means for stability: higher alpha leads to faster elite accumulation and earlier onset of overproduction dynamics. This is precisely what Turchin argues happened in the United States from the 1970s onward, and the American Crisis preset reflects these elevated mobility rates.
The gamma parameter, controlling labor market effects on wages, corresponds to factors like unionization, labor regulation, technological change, and globalization. Strong unions and protective labor laws increase gamma by strengthening workers' ability to capture productivity gains as higher wages when labor is scarce. Weak unions and unregulated markets reduce gamma, allowing more surplus to flow to capital owners and elites even when labor is nominally scarce.
The eta parameter, controlling elite extraction, relates to inequality and the distribution of market power. Concentrated wealth and monopolistic market structures increase eta: elites can extract more from workers and consumers when competition among elites is muted by their collective power. Antitrust enforcement, progressive taxation, and redistribution reduce eta by limiting how much elites can capture of the total economic surplus.
State capacity parameters connect to fiscal policy and state structure. The rho parameter (revenue coefficient) depends on the tax base and collection efficiency. Societies with broad tax bases and effective administration have higher rho. Societies with narrow tax bases, extensive exemptions, or weak enforcement have lower rho. The sigma parameter (expenditure rate) reflects the baseline cost of maintaining the state apparatus. The epsilon parameter (elite burden) captures how much state resources flow to elite patronage, corruption, and the maintenance of elite-serving institutions.
The instability parameters lambda_psi and psi_decay connect to social cohesion, political institutions, and the mechanisms societies use to manage conflict. Societies with effective conflict resolution institutions, shared identities that cut across class lines, and legitimate political processes for addressing grievances have higher psi_decay: stress dissipates quickly because the society has ways to process it. Societies with weak institutions, polarized identities, and illegitimate or unresponsive political systems have lower psi_decay: stress persists and accumulates because grievances have no constructive outlet.
When you experiment with parameters in the Explorer, you are implicitly exploring what happens when these real-world quantities change. Reducing alpha simulates tightening access to elite status through educational gatekeeping or credential reform. Increasing eta simulates rising inequality and elite extraction. Raising psi_decay simulates strengthening conflict resolution institutions. The Explorer does not tell you how to make these changes happen in practice, but it shows you their structural consequences, helping you identify which levers matter most for the outcomes you care about.
Common Mistakes and How to Avoid Them
Users new to the Explorer often make predictable mistakes in interpreting what they see. Knowing these pitfalls helps you avoid them and extract more insight from your explorations.
The first common mistake is treating PSI as a prediction of specific events. When the Political Stress Index crosses 0.6, users sometimes think "crisis happens now." But PSI is not a trigger mechanism. It is a measure of structural pressure. Crisis may manifest immediately, or it may take decades to materialize, or external events may intervene to either accelerate or postpone it. The threshold is statistical, derived from patterns across many historical episodes, not a physical constant. Use PSI to think about risk and tendency, not to predict timing.
The second mistake is ignoring the importance of initial conditions. Users focus on parameters and forget that where the simulation starts dramatically affects where it ends. Two simulations with identical parameters but different starting points can produce completely different outcomes. Always be aware of what initial conditions you are using and consider how different starting points would change your conclusions.
The third mistake is assuming that because the model produces cycles, all societies experience cycles. The model can produce cycles, but it can also produce stable equilibria, collapse without recovery, explosive growth, and chaotic dynamics, depending on parameters. Cycles are one possible behavior, not the only one. The historical observation that many societies did experience cycles suggests parameters often fall in cycle-producing ranges, but this is an empirical finding, not a theoretical necessity.
The fourth mistake is forgetting the normalizations. All state variables are normalized to dimensionless quantities between roughly 0 and 1.5. Population of 0.5 does not mean fifty percent of anything in particular; it means half of the carrying capacity defined for this simulation. Wages of 0.8 does not mean eighty percent of some dollar amount; it means eighty percent of the baseline subsistence level. Keep these normalizations in mind when interpreting results, especially when comparing to real-world data.
The fifth mistake is over-relying on a single visualization. The time series, phase space charts, and PSI chart all show different aspects of the same dynamics. Looking only at the time series might cause you to miss equilibrium structure visible in phase space. Focusing only on PSI might cause you to miss important dynamics in the other variables that affect PSI. Use all the visualizations together to build a complete picture.
The sixth mistake is extrapolating beyond the model's domain. The SDT framework was developed to explain agrarian and early industrial societies. Extending it to hunter-gatherer bands, ancient city-states, or hypothetical future civilizations may or may not be valid. The model's parameters and functional forms embody assumptions about how these societies work that may not hold in radically different contexts. Use judgment about when the model applies and when it does not.
The seventh mistake is confusing model behavior with real-world behavior. If you find parameters that produce perfect stability forever, that does not mean such societies are achievable in reality. The model omits many factors that could disrupt stability: external invasion, natural disaster, pandemic, technological revolution. Real societies face challenges the model does not represent. Similarly, if the model produces collapse, real societies might find adaptations the model does not capture. The model is a thinking tool, not an oracle.
The Development Process: How We Built the Explorer
The Explorer you use today is the result of an iterative development process that illustrates how we approach software engineering in this project. Understanding this process might interest those curious about how complex interactive tools come together.
The original Explorer (version 1) was built using Python and Pyodide, a technology that compiles Python to WebAssembly for browser execution. This approach let us reuse our existing Python simulation code directly in the browser. While functional, it had significant limitations. Initial load times were long because the entire Python runtime had to be downloaded and compiled. Simulations were slow enough that real-time parameter adjustment felt sluggish. Memory usage was high, causing problems on mobile devices.
For version 2, we rewrote the entire application in TypeScript, a typed variant of JavaScript that runs natively in browsers. This required reimplementing the SDT model equations and Runge-Kutta integrator in TypeScript, but the result was dramatically better performance. Initial load times dropped from several seconds to under one second. Simulations complete in tens of milliseconds, enabling true real-time response to parameter changes. Memory usage is a fraction of the Pyodide version.
The user interface uses React, a popular framework for building interactive web applications. React's component model let us break the interface into reusable pieces: parameter sliders, charts, summary cards, and the overall layout. Each component manages its own state and rendering, communicating through well-defined interfaces. This modular structure makes the code easier to understand, test, and modify.
Visualization uses Plotly.js, a charting library that provides interactive features like hover tooltips, zooming, and panning. Plotly handles the rendering complexity, letting us focus on specifying what data to display rather than how to draw pixels on screen. The charts respond to dark mode preferences by detecting the user's system settings and adjusting colors accordingly.
Development followed a test-driven approach. We wrote automated tests for the core model equations, comparing TypeScript outputs to Python outputs to verify numerical equivalence. This caught several bugs during the port and gives confidence that the TypeScript implementation matches our validated Python code. The test suite runs automatically on every code change, catching regressions before they reach users.
The preset configurations were developed iteratively. We started with default parameters matching Turchin's published values, then adjusted to produce dynamics that illustrate key concepts clearly within the 200-year default simulation window. The American Crisis and Roman Collapse presets were tuned by comparing model output to the historical time series in our case study essays, adjusting parameters until the qualitative behavior matched.
Version control through Git and GitHub tracks every change to the Explorer code. Pull requests with code review ensure that no changes merge without inspection. Continuous integration runs the test suite and builds a preview deployment for each pull request, letting reviewers see exactly what will ship before approving changes. This rigorous process has prevented numerous bugs and maintains code quality over time.
The Explorer's open-source codebase invites contributions. If you find bugs, want new features, or have ideas for improvement, you can open issues on GitHub or submit pull requests with proposed changes. The modular architecture makes it relatively straightforward to add new presets, additional visualizations, or even alternative model formulations. We welcome engagement from users who want to help improve the tool.
Case Study: Exploring a Hypothetical Intervention
To make the abstract principles concrete, let us work through a detailed case study using the Explorer. We will investigate what policy interventions might have stabilized a society experiencing American-style dynamics, developing a systematic approach you can apply to your own questions.
Begin by loading the American Crisis preset. This establishes our baseline: a society that has already begun experiencing structural pressures and will, under default parameters, cross into sustained crisis. Note the key characteristics of this baseline. The initial population is 0.9, very close to carrying capacity. The initial elite fraction is 0.15, substantially above the baseline 0.05. Initial wages are 0.7, already below the comfort level. Initial state capacity remains at 1.0, still functional. Initial political stress is 0.3, already elevated but below crisis threshold.
Watch the simulation unfold. Population continues to grow slightly toward carrying capacity. The elite class expands further, driven by high upward mobility. Wages decline as population grows and elites extract more surplus. State capacity begins to erode as the tax base shrinks and elite demands grow. Political stress climbs steadily, crossing the 0.6 threshold around year 25 and continuing to rise before stabilizing at a high level. This is the outcome we want to prevent.
Our first intervention hypothesis targets elite mobility directly. We know from sensitivity analysis that alpha has a large effect on outcomes. Reduce alpha from its American Crisis value of 0.008 to the baseline value of 0.005. Run the simulation again. The trajectory improves notably: PSI still rises but peaks lower, around 0.65, and the time spent above threshold is reduced. This is progress but not success. We need more intervention.
Continue reducing alpha to 0.004, then 0.003. At 0.003, something qualitative changes: PSI stays below 0.6 throughout the simulation. We have found a threshold. Alpha below about 0.003 keeps this society stable; alpha above produces crisis. But is reducing alpha to 0.003 realistic? That represents cutting elite production rates by more than half compared to the American Crisis level. Such a dramatic reduction might require draconian limits on higher education, professional credentialing, or economic mobility, all politically and ethically fraught interventions.
Let us try a different approach. Reset to the American Crisis preset. This time, instead of reducing alpha, we will try to increase the decay rate of political stress, simulating stronger institutions for conflict resolution. The default psi_decay is 0.05. Increase it to 0.08, then 0.10, then 0.12. Watch how the PSI trajectory changes with each increase. Higher decay flattens the PSI curve, reducing peak stress even though accumulation continues. At psi_decay of 0.12, the peak is noticeably lower, though still above threshold. This intervention helps but does not solve the problem alone.
Now combine both interventions. Set alpha to 0.005 (moderate reduction) and psi_decay to 0.08 (moderate increase). Run the simulation. The combined effect keeps PSI below 0.6 throughout, achieving stability through two partial interventions rather than one extreme one. This is often how real policy works: no single lever moves far enough to solve the problem, but several levers together can.
We can go further. Reset to American Crisis again and explore state capacity interventions. Increase rho from 0.2 to 0.25, increasing government revenue as a fraction of output. The improved state capacity provides some buffering, reducing the state-weakness contribution to PSI, but the effect is modest. Add a reduction in epsilon from 0.12 to 0.08, reducing the elite burden on the state (perhaps through anti-corruption measures or reduced patronage). The combination of higher revenue and lower elite burden substantially improves state capacity S over time, which contributes to lower PSI.
Through systematic exploration, we have identified several intervention packages that stabilize the American Crisis scenario. Package A: dramatically reduce elite mobility (alpha to 0.003). Package B: moderately reduce elite mobility and strengthen conflict resolution (alpha to 0.005, psi_decay to 0.08). Package C: moderately reduce elite mobility, strengthen conflict resolution, increase state revenue, and reduce elite burden (alpha to 0.005, psi_decay to 0.08, rho to 0.25, epsilon to 0.08). Each package achieves the goal through different combinations of intervention. The choice among them depends on which real-world policy mechanisms are most feasible, ethical, and effective, considerations the model cannot address but that the Explorer helps frame.
Philosophical Reflections: Models and Understanding
Using the Explorer raises deeper questions about the relationship between mathematical models and historical understanding. What does it mean to "understand" history through equations? What is gained and what is lost in translation from narrative to mathematics?
Mathematical models impose structure on the complexity of historical events. Where a historian sees contingency, individual choices, cultural contexts, and unique circumstances, the modeler sees variables, parameters, and equations. This translation necessarily loses detail. No equation captures the personality of Julius Caesar, the rhetoric of revolutionary pamphlets, or the fear of a crowd facing armed soldiers. The model abstracts away everything that makes history vivid and human.
Yet this abstraction is not merely loss. By stripping away details, models reveal patterns that narrative history obscures. The same underlying dynamics, expressed in different cultural clothing, produce similar outcomes across vastly different societies. Rome and Song China, separated by thousands of miles and centuries, both experienced demographic-structural cycles with similar timing and characteristics. The model shows us why: the underlying mathematics are the same, even though the surface manifestations differ completely. This kind of cross-cultural pattern recognition is nearly impossible without mathematical formalization.
Models also make assumptions explicit. A narrative historian holds implicit theories about how societies work, theories embedded in word choice, causal language, and narrative structure. These theories are often inconsistent, contradictory, or untestable because they remain implicit. Mathematical models force explicit statement of assumptions. The Explorer's equations are our theory of how demographic, elite, economic, and political factors interact. You can examine these equations, question them, modify them, and test them against data. You cannot do this with an implicit narrative theory because you cannot pin it down precisely enough to test.
The Explorer facilitates a particular kind of understanding: understanding through manipulation. By changing parameters and watching outcomes, you develop intuition about how the system works. This is different from narrative understanding, which operates through empathy and temporal sequence. Both kinds of understanding have value. Mathematical understanding reveals structural relationships; narrative understanding reveals lived experience. Neither replaces the other.
There is also humility in modeling. A model that fails to match historical data tells us something is wrong with our theory. This feedback is harder to obtain with narrative history, where flexible interpretation can accommodate almost any outcome. Models can be wrong in ways that are demonstrable and specific. This vulnerability to refutation is a feature, not a bug. It means modeling makes progress possible by eliminating theories that do not work.
The Explorer embodies this philosophy: it is a tool for thinking, not a source of definitive answers. It helps you explore the implications of structural-demographic theory, develop intuition about societal dynamics, and identify which factors most strongly affect outcomes. It does not tell you what will happen in any specific society or what policies to implement. Those judgments require integrating model insights with everything the model leaves out: context, values, practical constraints, and the irreducible complexity of human affairs.
Future Directions: What Comes Next
The current Explorer is not the final word. Several directions for future development could make it even more useful for exploring cliodynamic concepts.
Three-dimensional phase space visualization would let you see trajectories through the full five-dimensional state space projected into three dimensions. Currently we show two 2D phase space plots, which capture some but not all of the geometric structure. A 3D view with interactive rotation could reveal attractor structures, limit cycles, and chaotic dynamics more clearly.
Monte Carlo integration would enable uncertainty analysis directly in the Explorer. Instead of showing a single trajectory for fixed parameters, we could show confidence bands representing the range of outcomes when parameters vary within specified distributions. This would make the transition from deterministic exploration to probabilistic forecasting more intuitive.
Additional presets covering more historical cases would expand the Explorer's educational value. We might add presets for Ming China, Ottoman Turkey, Mughal India, or other societies analyzed through the SDT lens. Each new preset would offer another angle on how structural dynamics play out in different contexts.
Comparative views could display multiple scenarios side by side, making it easier to compare interventions. Instead of mentally remembering what one parameter setting produced while viewing another, you could see both trajectories on the same chart. This would facilitate the kind of what-if exploration that makes the tool most valuable.
Parameter space exploration tools could help identify boundaries between different behavioral regimes. Automated sweeps through parameter space, annotating regions that produce cycles, stability, collapse, or chaos, would give users a map of the model's behavior without requiring manual exploration of every combination.
Backward integration from a target state could answer questions like "what initial conditions lead to this outcome?" Instead of only running time forward from initial conditions, we might run time backward from a specified final state to discover what starting points reach it. This inversion could yield insights into the basins of attraction for different outcomes.
These features remain possibilities rather than commitments. Development priorities depend on user feedback, available time, and technical feasibility. If any of these directions particularly interests you, let us know through the project's GitHub issues or contact information. User input shapes what we build next.
Conclusion: From Understanding to Action
The Cliodynamics Explorer transforms abstract mathematics into tangible experience. By manipulating parameters and watching outcomes unfold, you develop intuition about the forces that shape societies over time. This intuition complements the theoretical understanding you gain from reading about Structural-Demographic Theory. Together, they provide a richer grasp of historical dynamics than either alone can offer.
But understanding is only the first step. The ultimate goal of cliodynamics is not just to comprehend history but to inform action. If we can identify the structural conditions that lead to instability, we might be able to modify those conditions before crisis arrives. If we can see which interventions are most effective in the model, we can prioritize those interventions in reality.
The Explorer is one tool in this larger project. It helps you see what parameters matter, how interventions might work, and where the boundaries of stability lie. It does not tell you how to actually reduce elite mobility or increase state capacity or raise wages in a real society. Those challenges require political, economic, and social analysis that lies outside the model. But the model helps you know what to aim for.
We encourage you to spend time with the Explorer. Try the experiments suggested in this guide. Invent your own. Develop your own intuitions about societal dynamics. Then return to the real world with new questions and new frameworks for thinking about the forces that shape our collective future. That is the promise of computational social science: not prediction, but understanding; not control, but informed action; not certainty, but a clearer view of the terrain we must navigate together.
The societies of tomorrow will face challenges that no previous generation has encountered, from climate change to artificial intelligence to demographic transitions unlike any in history. Yet the structural forces that drive instability, the interplay of population, elites, workers, states, and political stress, will continue to operate. Understanding these forces gives us tools for navigating uncertainty. The Explorer is one such tool, translating decades of historical research into interactive experience. By manipulating parameters and observing consequences, you can develop the kind of systems thinking that effective leadership requires. Whether you are a student, researcher, policy maker, or curious citizen, the Explorer offers something valuable: a lens for seeing the deep structures beneath the surface of history.
The Explorer awaits. What will you discover?
Getting Help and Providing Feedback
If you encounter problems using the Explorer, have questions about the model, or want to suggest improvements, several channels are available. The GitHub repository for this project includes an Issues section where you can report bugs, request features, or ask questions. We monitor these issues regularly and respond to user feedback. Before opening a new issue, check whether someone has already raised the same point; you might find the answer already posted, or you can add your voice to an existing discussion.
For more in-depth discussion of cliodynamics methodology, the broader research community includes active forums, conferences, and publications. Peter Turchin's blog and books provide primary sources on the theory underlying the Explorer. The Seshat Global History Databank, from which much calibration data derives, has its own documentation and community. Engaging with these resources can deepen your understanding far beyond what the Explorer alone provides.
If you build something interesting using the Explorer or incorporate it into teaching, research, or policy analysis, we would love to hear about it. Success stories and use cases help us understand how people engage with the tool and what improvements would be most valuable. You can reach us through the contact information in the project documentation or by opening a GitHub discussion.
Finally, if you have programming skills and want to contribute directly to Explorer development, pull requests are welcome. The modular TypeScript architecture makes it relatively straightforward to add new features, presets, or visualizations. Code review ensures quality, and automated testing catches regressions. Contributing to open-source projects is an excellent way to learn, and we try to make the contribution process as smooth as possible for newcomers.
The Explorer exists because we believe interactive tools can transform how people learn about complex systems. Your feedback and contributions make it better for everyone. Thank you for exploring with us, and we look forward to hearing what you discover.